This article is from ECHO Asia Note #30
[Editor’s Note: Peter is a freelance consultant based in Chiang Mai, Thailand, with a M.Sc. in Agriculture from Leipzig, Germany. Peter is a former researcher in “The Uplands Program,” a collaborative research program between Hohenheim University (Germany), Chiang Mai University (Thailand), and others. Contact: peter.elstner@gmx.net)
We have been looking for a reference guide to the soils of Southeast Asia for some time, and in the past have had to rely upon the fragmented soil classifi cations provided by most Southeast Asian countries. Those guides tended to include old data and were certainly not interactive. In this article, Peter Elstner explores the digital soil map of the world and the resulting seven major soil classes of Southeast Asia. Soils are the backbone and foundation for all sustainable agriculture and development, and knowing the type of soil in your community is essential for knowing the types of crops, development, and land use that can occur there. Be sure to check out the Reference Soil Groups. We hope that this guide will inspire you to explore the digital soil map and learn more about the soils in your area.]
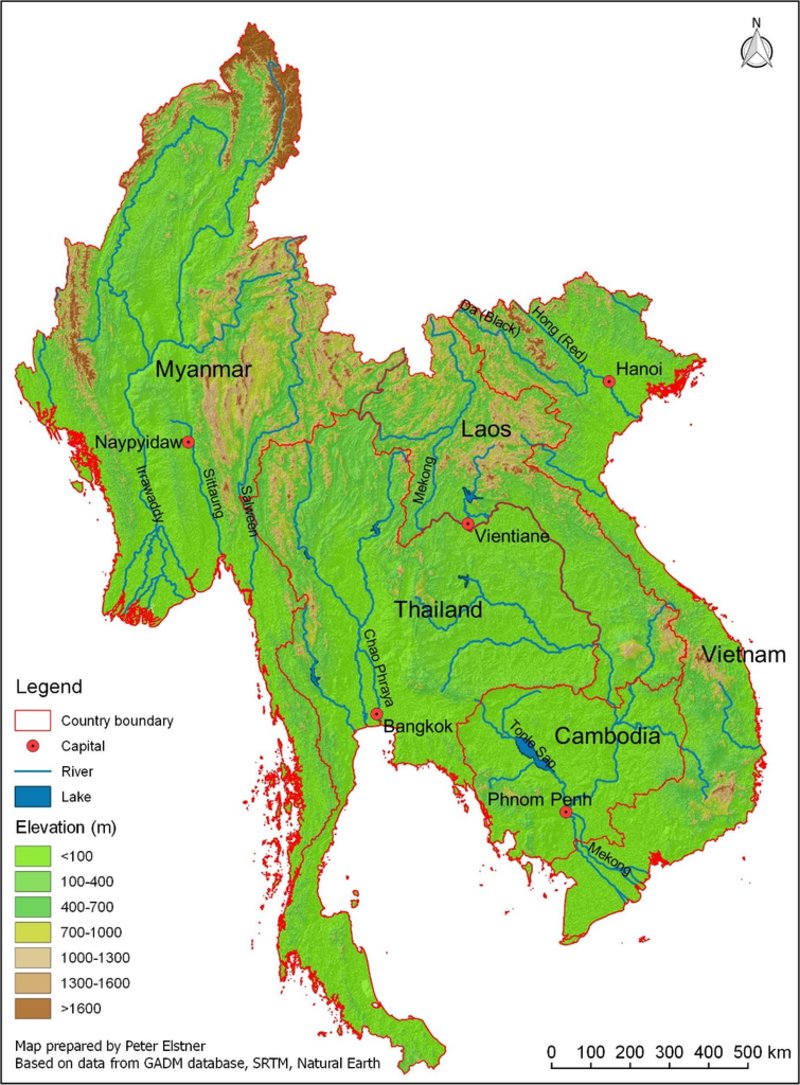
Map 1: Topographic map of Mainland Southeast Asia (FAO 2007).
This report describes and analyzes the soil distribution and characteristics of the main soil types in Mainland Southeast Asia (MSEA) that comprise the countries of Cambodia, Lao PDR, Myanmar, Thailand, and Vietnam (Map 1).
Geography
Mainland Southeast Asia (MSEA) is characterized by mountain ranges in the north, large plains and plateaus in the south, and large river systems that run from the mountains through the plains to the sea. The mountains along the border with China stretch mostly from north to south with elevations up to 5,800 meters. These mountains are the source of the large rivers, most importantly the Mekong, which runs through all countries, and the Irrawaddy in Myanmar. Both rivers spread into wide deltas before reaching the sea. Other important rivers are the Chao Phraya River in Thailand, the Salween and Sittaung rivers in Myanmar, and the Red River in Vietnam. Extensive fertile lowland plains along these rivers are highly suited for wet-rice cultivation. The center of Cambodia is dominated by a lacustrine plain formed by the inundations during the fl ooding of the Tonle Sap (Great Lake).
Climate
The climate in MSEA is normally determined by the monsoon. The cold, dry season from October to February is determined by the northeast monsoon and the hot, wet season from May to September by the southwest monsoon. The intermonsoon season in March and April is very hot and dry. Rainfalls are infl uenced by the orientation of main mountain ranges such as the Tenasserim Mountains in eastern Myanmar, and the Annam chain in Vietnam (FAO 1979). This means the central zone of Myanmar, Thailand and Southern Indo-China are located within the rain-shadow region and have a dryer climate. Average temperatures are nearly uniform (around 27°C) throughout the year in the southern region of MSEA (south of 17°N latitude). Inland areas in the northern region, with increasing latitude, have a yearly average temperature range from 20 to 30°C. These areas also have large variation in mean daily temperature, due to their continentality. Increasing altitude also reduces high summer temperatures and humidity. Northern Vietnam, Laos and the Myanmar Himalayas have a subtropical climate with relatively cold mean temperature below 15°C in winter (FAO 1979).
Data Sources and Data Availability
The Digital Soil Map of the World from the FAO (2007) provides comprehensive soil data for the whole world. The first version of these data was published in 1979 by FAO. Location, area, and distribution of soil types remain very similar – only the data structure and information were improved. The FAO uses its own soil classifi cation described in the “World Reference Base for Soil Resources” (FAO 2014) most recently updated in 2015. The WRB distinguishes 32 Reference Soil Groups (RSGs), which are the main soil types.
A detailed description of the RSG’s characteristics, management and use can be found in “Lecture Notes on the Major Soils of the World” (FAO 2001) as well as in “World Reference Base for Soil Resources” (FAO 2014).
A very useful source to visualize and obtain data for soil and soil characteristics is the website SoilGrids (https://www.soilgrids.org), a project of ISRIC-World Soil Information (ISRIC 2016). The project combines worldwide and national data from diff erent organizations and displays them in an interactive map. The maps are spatial predictions of soil types and properties based on machine learning and global statistical models. Data for some of the maps below were obtained from SoilGrids.
The Harmonized World Soil Database (HWSD) is another source for soil information. The HWSD is the result of a collaboration between the FAO and other organizations. This raster database contains data of selected soil characteristics (e.g. organic carbon, pH, water storage capacity, soil depth, cation exchange capacity) from over 15000 soil mapping units. The Database is available for download, along with an application to view the data, from the FAO website.
Soil data and maps based on other soil classifi cations are also available for MSEA. Several countries have used, and still use, the USDA Soil Taxonomy for their soil surveys. The USDA Soil Taxonomy classifi es soils according to several parameters (most commonly their properties) and in several levels: Order, Suborder, Great Group, Subgroup, Family, and Series. USDA and WRB are comparable to some extent, and soil maps and data using the USDA Soil Taxonomy (and other less common, sometimes only descriptive soil classifi cations) are available at the national level. Even though some of these data have a higher resolution and provide more detailed information, summarizing and comparing these data within MSEA is challenging, because diff erent classifications are used and the raw data is difficult to obtain.

Map 2: Dominant Soils in MSEA from the Digital Soil Map of the World (FAO 2007).
Distribution of Dominant Soils in Mainland Southeast Asia
The following map of dominant soils (Map 2) and the calculations of the area (Table 1) are based on the Digital Soil Map of the World by the FAO (2007). The Digital Soil Map uses the World Reference Base (FAO 2014) to classify soils, and diff erentiates areas by diff erent soil units. Each soil unit is comprised of a dominant soil (which covers the largest area) and one or more associated soils; e.g. a certain soil unit in Northern Thailand is comprised of 80% Acrisols (dominant soil), 10% Cambisols, and 10% Lithosols (both associated soils). Map 2 shows only the dominant soils in each area. The characteristics of the main soils in MSEA are described at the end of the article.
Table 1 shows the area and the percentage of each of the Reference Soil Groups (RSGs) in the fi ve countries and in the whole MSEA. There are 18 diff erent RSGs in MSEA, but not all RSGs are present in all countries. The calculation of the area for each RSG includes the proportional area of this RSG, both as dominant and as associated soil, in all soil units.
The results in Table 1 show that 970,247 km2 (or 50.4% of MSEA) of soils are classifi ed as Acrisols. Acrisols can be found in most parts of MSEA, especially in Laos, which has over 70% Acrisols. This type of soil is rare only in the river valleys, lowland plains, and along the large rivers.
Gleysols cover 190,261 km2, or 9.9% of the area in MSEA. They are dominant in the inundation areas of the Tonle Sap (Great Lake) in Cambodia. They are also common in the wide valleys of rivers, in their deltas, and along the coastline in Vietnam.
Cambisols (covering 185,086 km2, or 9.6%) are only dominant in western Myanmar. In other parts of MSEA, they are widespread as an associated soil with a distribution of 10-20%.
Only a few small areas are dominated by Lithosols, which cover 138,208 km2, or 7.2% of MSEA. However, they are part of many soil units as an associated soil, with a share of 10%.
Luvisols cover 101,772 km2, or 5.3% of MSEA. They occur mainly in the plain areas and in the plateaus in NE Thailand and Cambodia.
Fluvisols, covering 90,447 km2, or 4.7% of MSEA, can be found along the big rivers and in the deltas (Irrawaddy and Mekong), mostly alongside Gleysols.
Nitisols cover 87,321 km2, or 4.5% of MSEA. They mainly occur in the mountainous areas of Myanmar, Lao PDR, and Thailand, often in the same locations as Acrisols.
Map 2 displays the location and coverage of the 7 main RSGs in MSEA.
All other RSGs each occupy an area of less than 50,000 km2.
Reference: calculated based on Digital Soil Map of the World (2007) v. 3.6, FAO, scale: 1:5.000.000, |
||||||||||||||||||||||||||||||||||||||||||||||||||||||||||||||||||||||||||||||||||||||||||||||||||||||||||||||||||||||||||||||||||||||||||||||||||||||||||||||||||||||||||||||||||||||||||||||||||||||||||||||||||||||||||||||||||||||||||||||||||||||||||||||||||||||||||||||||||||||||||||||
Characteristics of the Main Reference Soil Groups in Mainland Southeast Asia
Specific soil characteristics, which contribute to soil health and crop plant production, are used to describe and compare the main soil types.
Fertility is a measure of soil’s contribution to the agricultural or ecological productivity of a given site. It incorporates information about many aspects of soil, including physical (e.g. texture, structure), biological (fauna), and chemical (e.g. nutrient availability, CEC, pH, organic matter) (Chesworth 2008).
Soil Structure is determined by the shape and size of the soil aggregates and their arrangement. A stable soil structure reduces erosion; improves infi ltration and water storage; and eases root penetration (Foth 1990).
Water holding capacity is the “ability of a soil to contain and to retain water”. It depends on many factors, including “texture, organic matter, porosity, and interconnectedness of pores” (Chesworth 2008).
Drainage refers to how well water infiltrates and moves downward through the soil (percolation). It is determined by the texture and structure of soil, by characteristics of lower soil horizons, and by the ground water table.
Soil fauna include a large number of species, ranging from microorganisms to mammals. Soil fauna has an important role in decomposition of organic matter, it also influences soil formation and soil structure. Most soil fauna are beneficial, but some are are harmful to plants (Chesworth 2008).
|
The chemical properties pH and CEC are discussed below.
A comparison of important soil characteristics of the main RSGs is shown in Table 2.
As Table 2 indicates, physical and chemical characteristics are the baseline used to diff erentiate soils. None of the RSGs shares a soil characteristic profi le with another. Well-distinguished soil types have developed over time in very diff erent topographic, climatic, and geologic conditions. However, two meta-classes with certain similarities can be diff erentiated:
1) Soils with low fertility. Acrisols, Nitisols and Lithosols tend to have low fertility because of their low pH, CEC, or shallowness (Lithosols). Since Acrisols cover the largest area of MSEA, soil fertility is low in many parts of MSEA.
2) Fertile soils with good chemical and physical characteristics. Gleysols, Cambisols, Luvisols, and Fluvisols are all relatively fertile. However, some of these RSGs are of limited use for agriculture due to other factors; for example, Gleysols and Fluvisols have poor water drainage.
Lithosols are listed as being low on the fertility scale in the previous table, but the indicators here don’t look so bad!
|
These two meta-classes are also confirmed when looking at the chemical characteristics pH, Cation Exchange Capacity (CEC), Organic Carbon, and Base Saturation (each described below), calculated from data of the Harmonized World Soil Database and summarized in Table 3 (FAO et al. 2012). The defi nition of these characteristics, their importance, and the thresholds for suitability for agriculture are based mainly on the documentation of the Harmonized World Soil Database (FAO et al. 2012).
pH, measured in a soil-water solution, is a measure of the acidity or

Map 3: pH of the topsoil in MSEA. Based on Soil Grids (ISRIC 2016).


alkalinity of soil. The pH of soil greatly impacts plant growth. Five major ranges of pH are important for plant production. Soils with:
• pH < 4.5 are extremely acid soils, such as Acid Sulfate Soils (mangrove soils). They are not suitable for crops.
• pH 4.5 – 5.5 are very acid soils and often suffer from aluminum toxicity. Some acid tolerant crops, including tea and pineapple, can be grown.
• pH 5.5 –7.2 are considered acid to neutral soils. They have the best conditions for nutrient availability and are suitable for most crops.
• pH 7.2 – 8.5 are carbonate-rich soils, with limited usefulness for crop production.
• pH > 8.5 are alkaline soils, which are often highly sodic (i.e. sodium reaches toxic levels) and poorly structured (columnar structure).
Cation Exchange Capacity (CEC) specifi es the total nutrient-holding capacity of a soil. A low CEC indicates low resilience and low ability to store nutrients. The amount and type of clay and the organic matter content determine the total nutrient storage capacity of a soil. Sandy soils generally have CEC less than 4 cmol kg-1. Soils with a CEC of more than 10 cmol kg-1 are considered satisfactory for most crops.
Organic Carbon, combined with pH, is the best simple indicator of soil health. Moderate to high amounts of organic carbon are associated with fertile, well-structured soils. 0.6% organic matter is considered low for soils. Soils that are very low in organic carbon (<0.2%) will need application of organic or inorganic fertilizer in order to be productive.
“The Base Saturation measures the sum of exchangeable cations/nutrients (Na, Ca, Mg, and K) as a percentage of the overall exchange capacity of the soil (including the same cations plus H and Al). The value often shows a near-linear correlation with pH” (FAO et al. 2012) Soils with a base saturation:
• < 20 % are considered de-saturated soils with similar limitations as extremely acid pH soils.
• from 20 – 50 % indicate acid conditions.
• from 50 – 80 % are neutral to slightly alkaline, and have ideal conditions for most crops.
• >80 % indicate calcareous, sodic, or saline soils.
As the numbers in Table 3 indicate, Acrisols and Nitisols are very acid soils. Because Acrisols make up half of the soil in MSEA, very acid soils predominate. Based purely on pH, all the other soils besides Acrisols and Nitisols are acid or neutral soils and suitable for agriculture.
In Table 3, the average CEC for Acrisols is below the “satisfactory” threshold, at 7.6 cmol kg-1, which suggests that large areas of MSEA have a low CEC. The other soils have a CEC suitable for crops. Whether this capacity for holding nutrients is actually met will depend on many other factors, including nutrient availability and pH.
On average, all soils of the MSEA region have organic carbon above 0.6% (though Luvisols are just above this threshold).
The correlation between base saturation and pH can clearly be seen by the data in Table 3. The two most acidic soils, Acrisols and Nitisols, have the lowest base saturation. The other soils have a base saturation in a favorable range for agriculture.
Map 3, 4 and 5 show pH, CEC, and Organic Carbon in MSEA based on data from SoilGrids (ISRIC 2016).
Taking into consideration that Acrisols cover 50% of the area, one would expect large areas with low pH and CEC. However, Maps 3 and 4 give a different impression and generally show higher values. Very acid soils are only prevalent in the very north and very south of Myanmar, in southern Thailand, and in the mountain ranges in Laos (Map 3). Soils with a CEC below the 10 cmol kg-1 threshold are only found in northeastern and southern Thailand (Map 4). However, all areas with pH below 5.5 and CEC values from 4 to 10 cmol kg-1 are in areas where Acrisols are dominant. Map 5 indicates that soils in some areas, mainly in Myanmar, are low in organic matter.
Since data from Soilgrids are predicted, and the values show an average of the properties of dominant and associated soils in an area, the accuracy is limited.
Soil Horizons
In addition to overall physical and chemical soil characteristics, RSGs are distinguished by properties of the horizon within the soil profile. A soil profile is a vertical crosssection through the soil. A horizon is the layer parallel to the ground surface. Each horizon differs from the horizon above or below based on physical, chemical or biological properties (Chesworth 2008).

Figure 1: Soil horizons by Wilsonbiggs [CC BYSA 4.0 (http://creativecommons.org/licenses/bysa/4.0)], via Wikimedia Commons
Seven major horizons, also known as Master Horizons, are differentiated:
H-horizon is an organic horizon with organic material on the surface that is saturated with water for prolonged periods.
O-horizon is also an organic horizon, but is saturated with water for only short periods and has 35 percent or more organic matter.
A-horizon is a mineral horizon at the surface that is a mixture of minerals and well-decomposed organic matter.
E-horizon (eluvial horizon) is a subsurface mineral horizon with a high concentration of sand and silt, due to the leaching of silicate clay, iron or aluminum to lower horizons.
B-horizon is a subsurface, mineral horizon of weathered parent material, characterized by a deposition of silicate clay, iron, aluminum, or humus (illuvial horizon).
C-horizon is the unconsolidated material (‘parent material’) from which the soil has formed.
R-horizon is bedrock, such as granite, basalt, limestone or sandstone.
Description of Main Reference Soil Groups
Following is a detailed description of the characteristics of the seven main Reference Soil Groups (RSGs) in the MSEA area (Map 2). The soil descriptions, characteristics, and uses are based on “Lecture Notes on the Major Soils of the World” (FAO 2001), the “World Reference Base for Soil Resources” (FAO 2014) and the “Encyclopedia of Soil Science” (Chesworth 2008).
Acrisols
USDA Soil Taxonomy: oxic subgroups of Alfisols and Ultisols; SE-Asia: Red-Yellow Podzols

Figure 2: Deep yellow Acrisol derived from granite in hilly terrain, China. Source: http://www. isric.org/about-soils/world-soil-distribution/acrisols
Acrisols (from L. acris, very acid) are strongly weathered acid soils with an accumulation of low activity clay (LAC) in the B horizon (Fig. 2). They have a low base saturation.
Acrisols occur mostly on old erosional or depositional surfaces, in regions with humid, monsoonal, subtropical, or warm temperate climates.
The profile development is typically AEBtC. Most Acrisols have a shallow, dark A-horizon with acid organic matter. The underlying E-horizon is normally yellowish and overlies a deeper yellow to red Bt-horizon (B-horizon with clay accumulation).
Characteristics:
• Low structural stability - weak microstructure and massive macrostructure
• Low cation-exchange capacity (CEC), low base saturation, low nutrient availability; therefore, low fertility
• pH: <4.5 in the surface horizon, 4.5 to 5.5 in B horizon
• Phosphor sorption and aluminium toxicity
Management and Use:
• Successful farming requires a prevention of erosion to preserve the surface soil and organic matter.
• Widely-used shifting cultivation with short occupation periods and a very long regeneration period is a welladapted form of land use
• Agroforestry is recommended as a soil-preserving alternative to shifting cultivation
• Adapted cropping systems with liming, fertilization, and careful management are required for sedentary farming
• Acid-tolerant plants, such as rubber, oil palm, and pineapple, can be successfully grown
Gleysols
USDA Soil Taxonomy: ‘aqu-’ suborders of entisols, inceptisols, and mollisols

Figure 3: Gleysol with a fl uctuating groundwater regime, Germany. Source: http://www.isric. org/about-soils/world-soil-distribution/gleysols
Gleysols (from R. gley, mucky mass) are wetland soils. In their natural state, they are continuously water-saturated for long periods of time. The predominantly grayish hues in the profi le below the water table result from the reduction of iron and manganese oxides.
Gleysols are particularly abundant in the low-lying river basins and coastal swamps of Southeast Asia.
The profiles of Gleysols are mainly A(Bg) Cr or H(Bg)Cr sequences. The dark grey Ah-horizon changes into a grey or olive Bg-horizon (strongly gleyed, grey colored horizon with anaerobic conditions due to waterlogging). The Cr-horizon (weathered or soft bedrock) is grey, olive or blue and anaerobic (Fig. 3). Where Gleysols remain waterlogged throughout the year, the topsoil (H-horizon) is a mixture of organic and mineral matter (muck).
Characteristics:
• Prolonged saturation with water, resulting in lack of aeration and poor conditions for soil fauna and roots
• Repeated wetting and drying may cause soil densifi cation; the soil structure may deteriorate if the soil is tilled when too wet
• Comparatively fertile in depressions or at the lower ends of slopes, due to their fi ne soil texture and slow rate of organic matter decomposition
• Compared to other adjacent upland soils, Gleysols have more organic matter, greater cation exchange capacity, higher base saturation, and higher levels of phosphorus and potassium
Management and Use:
• Adequately drained Gleysols can be used for arable cropping, dairy farming, and horticulture
• Liming creates a better habitat for microand meso-organisms, and increases the decomposition of soil organic matter and the supply of plant nutrients
• Gleysols are well-suited for wetland rice cultivation
• Tree crops can be planted after the water table has been lowered, or when planted on ridges
Cambisols
USDA Soil Taxonomy: Inceptisols

Figure 4: Reddish brown silt loam derived from slope wash material, China. Source: http://www. isric.org/about-soils/world-soil-distribution/cambisols
Cambisols (from L. cambiare, to change) are soils at an early stage in their formation. Cambisols generally have a brownish B-horizon showing evidence of transformation relative to underlying horizons.
Cambisols occur in level to mountainous terrain in all climates and under a wide range of vegetation types.
The typical Cambisol profi le has an ABC horizon sequence with an A-horizon over a yellowish- or reddish-brown B-horizon and a relatively unaltered C-horizon (Fig. 4).
Characteristics:
• Medium-textured (loamy to clayey), with good structural stability
• Highest clay content in the A-horizon
• High porosity, good water holding capacity, and good internal drainage
• Neutral to weakly acid soil reaction
• Satisfactory chemical fertility and an active soil fauna
Management and Use:
• Good agricultural land
• Used intensively for production of food and oil crops on irrigated alluvial plains
• In hilly terrain, used for a variety of annual and perennial crops or as grazing land
• Typically poor in nutrients, but with better fertility and higher CEC than associated Acrisols or Ferralsols in the humid tropics
Lithosols (Leptosols)
USDA Soil Taxonomy: Lithic subgroups of Entisols

Figure 5: Leptosol over hard Cretaceous limestone, Italy. Source: http://www.isric.org/abou tsoils/world-soil-distribution/leptosols
Lithosols are included in the RSG Leptosols. Lithosols include very shallow soils over continuous rock and soils that are extremely gravelly and/or stony (Fig.5). Lithosols can be found in mountainous regions, on hard rocks or erodible slopes. Lithisols typically show A(B)R or A(B)C profi les with a thin A-horizon.
Characteristics:
• mostly free-draining, low water holding capacity
• better physical and chemical properties on calcareous parent materials compared to non-calcareous parent materials
Management and Use:
• Not suitable for arable farming; can be used for grazing during the wet season, and for forestry
• Some areas in southeast Asia are planted with teak and mahogany
Luvisols
USDA Soil Taxonomy: Alfisols

Figure 6: Luvisol used for paddy rice cultivation, China. Source: http://www.isric.org/abou tsoils/world-soil-distribution/luvisols
Luvisols (from L. luere, to wash) are soils in which high activity clay is washed down from the surface to a lower accumulation horizon.
Luvisols are most common in flat or gently sloping land, in regions with distinct dry and wet seasons. In subtropical and tropical regions, Luvisols occur mainly on young land surfaces.
The profile is typically ABtC. The brown to dark brown A-horizon lays over a commonly (greyish) brown to strong brown or red Bt horizon. There is a marked textural diff erence between the horizons due to diff erent clay content (Fig. 6).
Characteristics:
• Favorable physical properties, granular or crumb surface soils, porous and well aerated
• Good drainage characteristics
• Water storage capacity is highest in B-horizon
• Surface soils may be sensitive to erosion
• Surface soils are normally wholly or partly de-calcified and slightly acid; subsurface soils have neutral reaction
Management and Use:
• These soils are generally at an intermediate stage of weathering and have high base saturation, making them highly fertile
• Suitable for many agricultural uses
• Luvisols on steep slopes require erosion control measures
Fluvisols
USDA Soil Taxonomy: Fluvents

Figure 7: Acid sulphate soil of the Bangkok Plain, Thailand. Source:http://www.isric.org/ about-soils/world-soil-distribution/fl uvisols
Fluvisols (from L. fluvius meaning ‘river’) include genetically young, azonal soils on water borne sediments from rivers, lakes, or sea.
Fluvisols can be found in periodically fl ooded areas of alluvial plains, delta areas (e.g. Mekong, Red River, Chao Phraya), valleys, and (tidal) marshes. Fluvisols with a thionic horizon (Acid Sulphate Soils) are found in the coastal lowlands of Southeast Asia (Vietnam and Thailand).
Fluvisols have a weak horizon differentiation (commonly AC-profi les) and are brown (aerated soils) and/or grey (waterlogged soils) in color (Fig. 7).
Characteristics:
• recent sedimentation and wetness determine the characteristics of Fluvisols
• Texture ranges from coarse sand to heavy clays
• Partly or completely wet soil, due to stagnating groundwater and/or flood water
• Terraces and river levees are better drained than soils in low landscape positions
• Neutral pH reaction
• Generally fertile (depending on the deposited material)
Management and Use:
• Suitable for annual crops, paddy rice, and orchards, or for grazing
• Flood control, drainage and/or irrigation are necessary
• Strongly saline tidal lands are best kept under mangroves
Nitisols (cf. Nitosols)
USDA Soil Taxonomy: kandic groups of Alfisols and Ultisols

Figure 8: Deep reddish Nitisol with moderately developed blocky structure, shown left of the scale; Nicaragua. Source: http://www.isric.org/ about-soils/world-soil-distribution/nitisols
Nitisols (from L. nitidus meaning shiny) are strongly weathered, deep, red, welldrained tropical soils. Nitisols have a clayey subsurface horizon with blocky structural elements that crumble into polyhedric (‘nutty’) peds with shiny faces.
Nitisols can be found in level to hilly land under tropical rain forest or savannah vegetation.
The profile has mostly an AB(t)C horizon sequence, is red or reddish brown, and is deeper than 150cm (Fig. 8).
Characteristics:
• One of the most fertile soils in humid tropics
• Stable, well-drained soils with good soil structure, good porosity, fair water holding capacity, and very good rootability
• Quite resistant to erosion
• Cation exchange capacity (CEC) higher than other tropical soils (Ferralsols, Lixisols, and Acrisols), because of high clay content and soil organic matter
• Soil pH between 5.0 and 6.5
• Low level of ‘available’ phosphorus, so application of P-fertilizer is needed
Management and Use:
• Typically used for plantation crops (including cocoa, coffee, rubber, and pineapple) and for food crop production
Conclusion
The world has moved a long way from the early paper soil maps to the interactive maps and resources provided by SoilGrids, the Harmonized World Soil Database, and the Digital Soil Map of the World. Soil is essential for all terrestrial life, and it is essential to know the fertility and capacities of your soil in order to manage it wisely. It is hoped that this reference guide can serve a use in your agricultural and community development projects by providing a background of the most common soil types in the Mainland Southeast Asia Region and beyond.
References
Chesworth, W. (Ed.). 2008. Encyclopedia of Soil Science. New York: Springer.
FAO. 1979. Soil Map of the World. Volume IX Southeast Asia. Paris: FAO, UNESCO.
FAO 2001. Lecture Notes on the Major Soils of the World. Eds. P. Driessen, J. Deckers, O. Spaargaren, and F. Nachtergaele. World Soil Resources Report 94. Rome: FAO. Available: http://www.fao.org/3/a-Y1899.pdf
FAO. 2007. Digital Soil Map of the World (2007-02-28). Version 3.6, 1:5.000.000 scale. Rome: FAO. Available: http://www.fao.org/ geonetwork/srv/en/metadata.show?id=14116
FAO. 2014. World Reference Base for Soil Resources. Updated 2015, World Soil Resources Report 106. Rome: FAO. Available: http://www.fao.org/3/a-i3794e.pdf
FAO/IIASA/ISRIC/ISSCAS/JRC .2012. Harmonized World Soil Database (version 1.2). Rome: FAO, and IIASA, Laxenburg, Austria. http://www.fao.org/soils-portal/ soil-survey/soil-maps-and-databases/harmonized-world-soil-database-v12/en/
Foth, H. D. (Ed.). 1990. Fundamentals of Soil Sciences. Hoboken, NJ: Wiley & Sons.
ISRIC. 2016. Soil Grids- World Soil Information. Available: https://www.soilgrids. org/#/?layer=geonode:taxnwrb_250m