Introduction
 By integrating legumes into cropping systems, small-scale farmers in low-resource settings can invest in the long-term health and resilience of their soils. Success or failure depends largely on choosing the right legume(s). With that in mind, this document presents insights on legume selection that ECHO has learned from comparing legumes across parts of Southeast Asia and through five seasons of legume screening and intercropping trials in South Africa. References to ECHO publications, available on www.ECHOcommunity.org, are abbreviated as AN (Asia Notes), BPN (Best Practices Notes), EDN (ECHO Development Notes), and TN (Technical Notes). Numerous other sources of information are mentioned in the References and Further Reading sections of this document.
What is a GMCC?
Green manure/cover crops (referred to hereafter as GMCCs) are plants used to cover and improve the soil, as well as to positively impact the ecology of the land and other crop plants. Many plants can be used as GMCCs, but this document focuses on legumes—plants belonging to the Fabaceae family. They are known for their ability, in conjunction with soil bacteria, to convert nitrogen from the atmosphere into ‘fixed’ nitrogen that plants can take up. This process is called biological nitrogen fixation.
What are the benefits of leguminous GMCCs?
THEY THRIVE IN POOR SOILS
Land available to small-scale farmers is often characterized by difficult growing conditions. Depending on the location, for example, farm lands may be too wet, dry, steep, eroded, acidic, alkaline, saline, or infertile for optimal growth and yield of food plants. Where possible, land that is marginal for crop production should be used for other purposes such as pasture for livestock. However, many farmers have little choice but to produce their staple food plants on less-than-ideal soils.
One of the most commonly deficient nutrients on marginal/degraded land is nitrogen. Because of their ability to utilize atmospheric nitrogen, legumes are often able to grow in nitrogen-deficient soils. Many tropical legumes also have extensive root systems that are able to draw moisture and nutrients from deep in the soil. Moreover, tropical legumes are diverse, with some adapted to humid climates and others to more arid zones. For these reasons, tropical legumes are recognized for their potential to grow under a range of difficult growing conditions.
THEY ADD ORGANIC MULCH TO THE SYSTEM
Soil preservation is key to farmers’ capacity to produce enough food for their families over time. This, in turn, depends to a large extent on maintaining soil organic matter. Many soil functions, including aeration, drainage, nutrient retention, and the cycling of nutrients by microbes, influence crop growth and are linked to organic matter.
One of the tenets of conservation agriculture is that a field should be continuously covered with plant-based mulch (Figure 1). Mulch replenishes soil organic matter; it also suppresses weeds and protects against soil erosion. But most farmers do not have enough crop residue to cover the soil, especially when they are farming depleted soils and have to remove some of the residue to feed livestock (Palm et al. 2014).


Any solution is likely to be multi-faceted. Farmers who know the value of organic mulch may decide to keep at least a portion of their crop residues on their field. They may also be able to supply a modest amount of animal manure. Additional mulch could come through the integration of tropical legumes into their staple grain crops. Table 1 shows results from an ECHO trial in South Africa, in which a mix of lablab and cowpea contributed 5 metric tonnes per hectare of plant based mulch when grown with maize.
|
Table 1. Sources and quantities of organic material that, with the integration of legumes, could add up to 10+ metric tonnes per hectare (t/ha) of organic material returned to the soil. |
|
|
* These numbers are based on a trial in which maize planting stations were spaced 1 m (between rows) X 0.6 m (within each row), with legumes (cowpea and lablab) planted in between the maize rows. This resulted in one row of maize alternating with one row of legumes. |
|
|
Source of organic material |
Dry weight (t/ha)* |
|
Maize residue left in the field after removing 50% for livestock feed |
3.5 |
|
Cattle manure placed in maize planting stations |
3.5 |
|
Residue from legumes intercropped with maize |
5 |
|
Total amount of organic material returned to the field |
12 |
THEY CONTRIBUTE TO SOIL FERTILITY
As legume plants grow, nitrogen accumulates in the vines and roots (biomass). With much of their nitrogen derived from the air, through biological nitrogen fixation, tropical legumes are capable of accumulating substantial amounts of nitrogen. In ECHO trials in South Africa, over 100 kg of nitrogen per hectare were accumulated in above-ground biomass of legumes such as cowpea (Vigna unguiculata), horse gram (Macrotyloma uniflorum) sunn hemp (Crotalaria juncea), and velvet bean (Mucuna pruriens).
Many tropical legumes have root systems that effectively draw nutrients from a large volume of soil. Thus, the biomass they contain is not only rich in nitrogen but also in other nutrients such as phosphorus and potassium. When legume residues are left on the field, the nutrients they have accumulated are returned to the soil. Particularly when legume mulch is combined with practices that prevent soil erosion, the added organic material helps maintain and even improve soil fertility. Figure 2 shows the effect that legumes had on soil nitrogen in a South African soil four months after they were planted. Note that nitrogen mineralization (conversion by microbes of organic nitrogen in the soil to inorganic nitrogen) rates were fastest in soil just underneath the legume residue.


OTHER BENEFITS
Many legumes serve as a pulse (dry bean) crop, adding to farmers’ food supplies. Most legumes can also be used to feed livestock. Just remember that the nutrients contained in any plant parts harvested for food/fodder or other uses will not be returned to the soil. Legumes with dense leaf canopies suppress weeds by shading the ground. In so doing, they also protect soils from erosion and extreme temperatures. In the warm tropics, reduced exposure to the sun helps maintain an environment conducive to soil life that would otherwise be unable to flourish. Grown right in farmers’ fields, legumes also make organic matter easier to apply; whereas compost piles need to be watered and the finished compost must be transported to the field.
Principles
1 Properties of legumes most likely to improve the soil
1.1 ABLE TO THRIVE UNDER LOCAL CONDITIONS
Select legumes that grow well under local conditions and on local soils. Daryanto et al. (2015) explored the relationship between soil texture and legume performance; they pointed out that fine-textured, clay soils retain water and nutrients but restrict root growth. Coarse, sandy soils are usually low in fertility and do not retain moisture. Overall, medium-textured soils are best, but smallholder farmers rarely have ideal soils to work with. Do your best to find a legume that will grow well---even if not optimally---in less-than-ideal soil. Note that some phosphorus is needed in order for legumes to fix nitrogen (Ssali and Keya 1983; Zahran 1999).
When matching legumes to local soils, also consider the seasonal climatic conditions. In southwest Florida, for example, lablab (Lablab purpureus) can be grown successfully during the cooler, drier times of year, but performs poorly during the hot, humid summers.
1.2 ABLE TO COVER THE GROUND WELL
Legumes vary in their growth habit. Some varieties of cowpea, lablab and velvet bean have extensive vines that quickly spread and cover the ground. In an ECHO intercropping trial on sandy soil, cowpea spaced 60 cm (in-row) X 100 cm (between rows) completely covered the ground in 6 to 8 weeks. Pigeon pea (Cajanus cajan), sunn hemp, and tephrosia (Tephrosia vogelii and T. candida) are more erect, with a shrub-like growth habit. Erect legumes like these can still cover the ground well, provided they are not spaced too far apart.
1.3 CAPABLE OF PRODUCING ENOUGH BIOMASS
Large amounts of biomass mean more mulch, but this is a trade-off. Short-statured, compact legumes (including some short-duration cowpea varieties) have advantages such as early maturation, ease of mechanical cultivation and harvest, and minimal interference with neighboring cereal plants. However, they are not as likely to produce large amounts of biomass. Similarly, short-duration pigeon pea varieties produce pods sooner than long-duration varieties, but long-duration types generate much more biomass (Figure 3).


1.4 ABLE TO FIX NITROGEN
If a legume grows well on nitrogen-limited soil, it is most likely fixing nitrogen. However, it is still a good idea to examine root nodules (swellings) of leguminous plants. A nodule colonized by nitrogen-fixing bacteria should be easy to rub off the root with your thumb. When the nodule is cut in half, a pink/red to purple color (Figure 4) indicates the presence of an oxygen carrier called leghemoglobin, which in turn indicates that bacteria are actively fixing nitrogen. By contrast, a green or nearly white color is a sign of ineffective nitrogen fixation, or that the needed rhizobial bacteria are not present. Inoculation with the appropriate bacterium can enhance nitrogen fixation, especially the first time a legume is planted in an area. Most of the legumes grown in ECHO trials have formed pink/red nodules without inoculation, indicating that the appropriate strains of bacteria are already present in the soil. See EDN 101 for more information about legume inoculation.


2 Requirements for farmer acceptance
2.1 LOW COST
Farmers in low-resource settings usually operate on small parcels of land with very limited cash. They are unlikely to devote precious land and/or labor to growing a legume just for soil improvement. Moreover, they cannot afford to purchase expensive seed. With these realities in mind, legumes most likely to be adopted will be readily available and will thrive without the need for extensive land preparation, fertilizers, and pesticides.
2.2 TANGIBLE BENEFITS BEYOND SOIL IMPROVEMENT
Costs will be even lower if a legume is multi-purpose. For example, if it covers the ground well, it might actually reduce farmers’ labor by shading out weeds. If it provides edible beans or animal fodder, it could lower farmers’ food costs and possibly even serve as a means of income generation. This is especially true if a legume persists into the dry season, producing food on land that would not otherwise be in use.
2.3 EASILY INTEGRATED WITH EXISTING CROPS
As mentioned above, land is a precious resource. By integrating legumes into the production of staple cereal grains, a farmer would not need a separate plot of ground to grow legumes. For this to work, the legume should not compete strongly with the main crop. An ECHO document, BPN 6,discusses strategies for minimizing interference of legumes with a main crop.
Best Practices
1 Understand the local context
1.1 EXISTING LEGUMES
Farmers may already be utilizing legumes in various ways. Find out what legumes, if any, are being grown. If farmers are growing legumes, ask how they are being used. Perhaps you could help by introducing a variety (of a legume that farmers are already growing) that produces more vine growth and/or bean yield.
1.2 SEED AVAILABILITY

Figure 5. Seeds of various legumes prior to planting. Source: Tim Motis
Seeds may be available in markets or in individual farmers’ personal stores. Depending on the country/region, seeds may be available from agricultural stores, NGOs, or research institutions.
If farmers want seed of a particular legume for which bulk quantities are hard to source, you may need to give initial assistance to help farmers obtain seed. If you have a small quantity of seed with which to start, consider contracting with a few local farmers to multiply seeds that can be shared with other farmers or with a local seed supplier.
1.3 GROWING CONDITIONS
When do the rainy and dry seasons occur, and how much rainfall is received annually? What are the soils like as far as texture and fertility? What are the maximum and minimum temperatures? Answers to these questions will help you select legumes that will most likely grow well in your area.
2 Screen promising crops
2.1 IDENTIFY PROMISING LEGUMES TO TRIAL
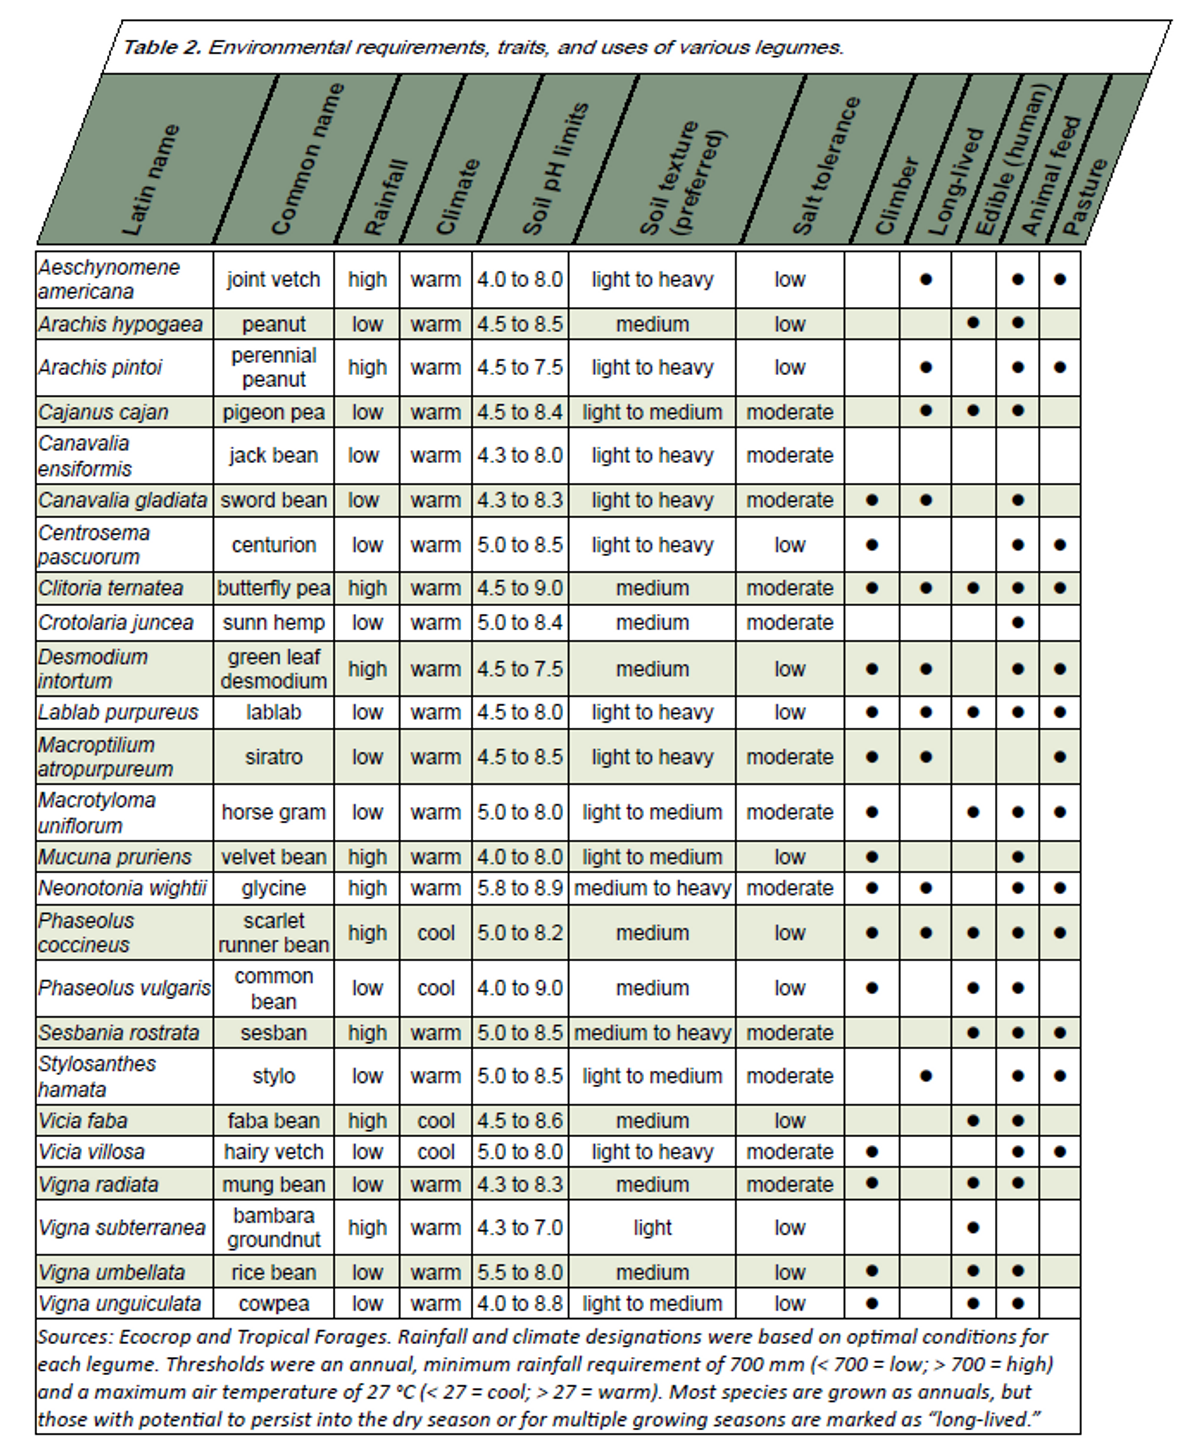
Assembled by ECHO staff, based on field observations and online information (Ecocrop and Tropical Forages), Table 2 summarizes growing requirements, traits and uses of a number of legumes. It indicates, for example, which legumes could be considered for low- or high-rainfall areas, or for warm versus cool climates. Explanation of how legumes were categorized are explained for the factors below:
|
Rainfall and climate: Distinctions were made based on optimal conditions for each legume, as explained in a footnote at the bottom of the table. The rainfall and temperature requirements for some species, such as Neonotonia wightii, were close to the thresholds used to categorize them as high vs low rainfall or warm vs cool climate legumes. This table is only a starting point for assessing legumes. Sources, such as those given at the bottom of the table, should be consulted for more detailed information. Soil pH: Although a near-neutral (7.0) soil pH is preferred, the ranges given indicate the extent to which each legume tolerates acidic (<7.0) or alkaline (> 7.0) soil conditions. Soil texture: Light soils are sandy, coarse-textured soils. Heavy soils are fine-textured, with a high percentage of clay. Medium textured soils are intermediate in the amount of sand and clay they contain. Salt tolerance: These designations were based on the tolerance of legumes to varying degrees of soil salinity as measured in deciSiemens/m (dS/m). Legumes were described as having low (< 4 dS/m) or moderate (4 to 10 dS/m) salt tolerance; none of the legumes in the table were described by Ecocrop as being tolerant of over 10 dS/m of salinity. Climber: Legumes were indicated as climbers if they have twining vines capable of ascending neighboring crops, a trait that may influence a farmer’s management decisions if he or she wishes to avoid legume interference with other crops. Some legumes are more vigorous climbers than others. Lablab and velvet bean, for instance, are more likely than cowpea to overtop weeds or stalks of cereal plants, even though all three legumes have vines that can climb neighboring plants. Other legumes, such as pigeon pea, are erect shrubs that can grow as tall or taller than maize, but don’t have climbing vines. Long-lived: Most species are grown as annuals, but some were indicated as “long-lived” if they have potential to persist into the dry season or to continue growing over more than one season. Edible: Legumes are indicated as edible if at least one part of the plant is commonly used as food for human consumption. Consult other sources to find out which parts of a given legume are edible, and at what stage. Animal feed vs pasture: Many legumes are safe for both humans and animals. Some legumes suitable for animal feed are typically cut and carried to animals. Others are best suited for grazing in a pasture. |
Many of the legumes in Table 2 are featured in a GMCC Selection Tool hosted on www.ECHOcommunity.org. Other sources of information are found in the Further Reading section of this document; also see the Tropical Cover Crop Selection Chart (Figure 17) in the Appendix section. Roland Bunch’s book, Restoring the Soil, covers legume selection criteria in depth, featuring a decision tree based on 91 farmer cropping systems involving leguminous GMCCs.
2.2 EVALUATE PROMISING LEGUMES UNDER FARMER CONDITIONS
You can learn a lot from small test plots on soils that are representative of farmers’ fields. Plots dimensions can vary depending on the size of the plants being grown and how far apart they are spaced. To account for variability between plants, aim for a minimum of ten to twelve plants per plot. Growing each legume in just one plot (Figure 6a) allows for ease of management and requires less space than trialing them in a randomized, replicated design (Figure 6b). On the other hand, replicated trials allow for greater confidence in results. Replication can also be achieved by conducting multiple non-replicated trials (e.g., one in each of several locations) such as that shown in Figure 6a. If you want to be able to collect data for statistical analysis, aim for at least three replications. Figure 7 illustrates what a trial might look like.


Figure 8. Grid made from PVC to measure percentage of the ground covered by jack bean in Thailand. Source: Patrick Trail
Here are a few other suggestions for evaluating legumes in the field:
- Locate the trial where it can easily be shown to farmers.
- Grow the crops in the same manner that local farmers would. For instance, if farmers are unable to irrigate their fields, plan to rely on rainfall.
- Separate the plots by at least a meter, and preferably more. This allows for space to walk between plots, and minimizes the problem of vines growing into nearby plots. It also reduces the possibility that tall legumes will shade low-growing legumes.
- Consider initially planting only legumes, rather than planting them with a grain crop. After you evaluate legumes by themselves, you can do follow-up trials to see how they perform when grown together with a cereal crop.
- Time your planting date to coincide with farmer planting routines. Planting time will likely depend on the onset of the rainy season, duration of the growing season, and farmers’ normal planting times. Involve farmers as much as possible in planning decisions like this.
- Decide what you are going to measure. Options could include plant biomass (fresh and/or dry), bean yield, percent ground coverage (Figure 8), canopy height/width, and the biomass of weeds growing underneath the legume canopy. What would farmers consider to be key attributes of a desirable legume?
|
How to assess the nitrogen contribution of legume biomass Crop plants accumulate nitrogen (N) as they grow. By quantifying this, we can get an idea of how much nitrogen that material, if left on the field, can return to the soil. Do this by weighing the biomass in a well-defined area. In ECHO trials, we have often done this by cutting, drying and weighing all the above-ground biomass within a square meter, using a PVC square like that shown in Figure 8. If there is an in-country laboratory or university that does mineral analysis of plant tissue, the next step is to grind a representative sample of the dried biomass into powder; most laboratories ask for a minimum of 10 grams (g) of powder. Results for nitrogen concentration are usually reported as percent (%) dry weight. Let us say that your dried sample, collected from 1 square meter (m), weighs 800 g. You are not able to send samples off to a lab, so estimate that your plant tissue contains 2.5% N. (The actual value could be as high as 3% or even 4%. Vines left on the soil surface after bean harvest will typically have a lower N concentration than those incorporated into the soil before pods are formed.) Here, then, is how you calculate N accumulation in kilograms per hectare (kg/ha): Step 1: convert 800 g/m into kg/ha, knowing that there are 10,000 m2/ha Step 2: calculate how much of the 8,000 kg/ha dry matter is N, knowing that 2.5% of it is N Nitrogen losses occur, due to leaching and volatilization, but this gives you a way to evaluate N contribution. |
Example of an ECHO GMCC trial in Asia
To show how a trial can be conducted, and what can be learned, an ECHO GMCC evaluation trial is summarized here. With support from the CFH (Conservation, Food and Health) Foundation, four legumes were trialed in each of five countries in Southeast Asia. The goal was to improve our understanding of how climate influences legume growth, which would, in turn, enhance our ability to respond to legume selection inquiries. The work was done in partnership with individuals/organizations serving small-scale farmers, whose names are acknowledged in Table 3.
|
Table 3. Location of trial sites and names of partnering organizations/collaborators. |
|||
|
Country |
Location |
Organization |
Collaborator |
|
Bangladesh |
Bogra |
Mennonite Central Committee |
Jahangir Alam |
|
Cambodia |
Mondulkiri Province |
Caritas |
Sony Sam |
|
Myanmar |
Southern Shan State |
Lilypad Co., Ltd. |
Melanie Edwards |
|
Philippines |
Palawan Island |
Aloha House Inc. |
Keith Mikkelson |
|
Thailand |
Mae Ai |
ECHO Asia Seed Bank |
Staff |
Methods
Cowpea, jack bean, lablab, and rice bean seeds were direct-sown into 2 X 2 meter rain fed plots with no fertility inputs. Seeds were planted at a 50 X 50 cm spacing, as shown in Figure 9. Table 4 describes the soil texture, elevation and planting dates for each site. Data loggers were buried at a depth of 10 cm, and kept free of weeds, to monitor soil temperatures. Rainfall and air temperature data were collected from online weather services, reflecting locations as close as possible to the trial sites. Above ground biomass (leaves and stems) was cut and weighed from half of each plot when the plants began forming pods. A sub-sample (200 grams) of fresh, green material was dried and weighed, with the sub-sample dry weight used to calculate dry matter in terms of metric tonnes per hectare (t/ha).
|
Table 4. Soil, elevation, and planting date information for green manure cover crop evaluation trials in Southeast Asia in 2016 |
|||
|
Country |
Soil texture |
Elevation (m) |
Seeding date |
|
Bangladesh |
Loam |
25 |
14 August |
|
Cambodia |
Clay (red) |
500 |
27 August |
|
Myanmar |
Silt loam |
1376 |
1 August |
|
Philippines |
Clay |
55 |
9 October |
|
Thailand |
Sandy loam |
310 |
10 August |

Figure 9. Design and spacing of a non-replicated legume trial implemented by ECHO in Southeast Asia.
Climate
Soil temperatures (Figure 10), from 0 to 90 days after seeding, varied across the trial sites (data not obtained at the Philippines site). Minimum and maximum temperatures were highest at the Bangladesh and Thailand sites, with Myanmar being the coolest site.


Air temperatures (Table 5) were consistent with soil temperatures; they showed that the Philippines site was one of the warmest sites, with maximum temperatures similar to those of Thailand and Bangladesh.
|
Table 5. Minimum and maximum temperatures averaged over each month at each of five trial sites. |
||||||||||
|
Bangladesh |
Cambodia |
Myanmar |
Philippines |
Thailand |
||||||
|
Month |
Min |
Max |
Min |
Max |
Min |
Max |
Min |
Max |
Min |
Max |
|
August |
28 |
35 |
26 |
32 |
21 |
28 |
31 |
35 |
25 |
35 |
|
September |
27 |
34 |
26 |
33 |
20 |
30 |
31 |
34 |
25 |
35 |
|
October |
25 |
34 |
25 |
32 |
18 |
29 |
31 |
34 |
24 |
35 |
|
November |
22 |
33 |
24 |
32 |
13 |
22 |
31 |
34 |
24 |
35 |
|
December |
20 |
31 |
23 |
28 |
11 |
21 |
29 |
32 |
19 |
33 |
Another way to assess crop growth in relation to temperature is to track the accumulation of heat over time, which can be done by calculating “growing degree days” (GDD) as shown in Figure 11. GDD are used to predict when a crop will mature. For this trial, GDD were calculated as shown in Figure 11 using soil temperature, which could be a more accurate reflection of root zone conditions than air temperature. As expected, the site in Bangladesh accumulated GDD the fastest, with the Myanmar site accumulating the fewest GDD. Figure 11 tells us that at least 1000 GDD were accumulated over a three-month period, and can be used to show how many GDD are needed to reach a given growth stage (e.g., flowering or pod formation).
Formula: GDD = ([maximum temperature + minimum temperature]/2) - minimum temperature for crop growthFor example, let us say that on a given day temperatures reached a minimum of 25°C and a maximum of 32°C. The crop for which we are calculating GDD stops growing if temperatures drop below a minimum of 10°C. [For the sake of simplicity, a value of 10°C, commonly used for calculating GDD for maize, was used for calculating GDD for all the legumes in the Asia legume trial.] Therefore, the number of GDD for that day = ([32 + 25]/2) - 10 = 18.5. This is done for each day that the crop is grown, allowing you to track the cumulative number of GDD over the growing season. |
 |

Figure 12. Monthly rainfall at each of five trial sites (countries) where legumes were evaluated.
Rainfall each month in 2016 is shown in Figure 12. Generally, rains began in May/June. Other than at the Philippines site, where the rains persisted in to December, the rainy season ended in October/November. The least and highest rainfall was received at the Philippines and Bangladesh sites, respectively.
Results and lessons learned
Number of days to pod formation (Figure 13) indicates how fast each legume grew. Overall, cowpea matured faster than the other legumes. Cowpea matured soonest (about 45 days after sowing) at the Bangladesh site, a finding consistent with the fact that GDD accumulated the fastest in Bangladesh (Figure 11). Statistically, cowpea harvest time was strongly and inversely correlated (Pearson correlation coefficient [PCC] > -0.93; P <0.0001) with GDD, meaning that cowpea maturation time decreased with increasing GDD. With its tendency to establish quickly, cowpea could be a good choice for areas with short rainy seasons that accumulate heat units (GDD) quickly. Early-season ground coverage is another reason to select a fast-growing legume.

Figure 13. Days to pod formation for legumes trialed in each of five countries.
Jack bean, lablab, and rice bean took closer to three months to begin producing pods. Longer-term legumes provide late-season ground coverage and food/fodder options; they are good options for increasing dry-season productivity, if the preceding rainy season is long enough for them to become established.

Figure 14. Dry matter production (metric tonnes/hectare) for legumes trialed in each of five countries.
The amount of above-ground dry matter (Figure 14) reflects how well a legume grows in a given location. Jack bean produced the most biomass in every location, generating the equivalent of 12 t/ha of dry matter in Bangladesh and the Philippines and 9 t/ha in Thailand. Rice bean generated close to 9 t/ha in Bangladesh and 6 t/ha in Thailand. Cowpea produced 5 or more t/ha in Bangladesh and the Philippines.
Overall, legumes grew the best in Bangladesh (Figure 15) and in Thailand. Both of these sites had a medium (loamy) soil texture, rapidly accumulated GDD, and received a high amount of rainfall. Although cowpea and jack bean thrived at the Philippines site, lablab and rice bean did not. The Philippines was the driest of the five sites (Figure 12), so perhaps there was not enough rainfall for lablab and rice bean to become established. Lablab is known for its deep roots and drought resistance, but it needs more moisture during a slow establishment phase.


None of the legumes grew well at the Cambodia and Myanmar sites. Two factors that may have limited legume growth are low levels of soil phosphorus and cool temperatures. Maejo University in Thailand tested the soil from the Cambodia site and categorized its phosphorus level as “very low” (only 2 ppm; 10 to 12 ppm would have been needed for “moderate” status). By comparison, the soil in Bangladesh had 438 ppm phosphorus. Legumes need phosphorus to be able to fix nitrogen. It is also possible that root growth could have been restricted by the clay soil. The Myanmar site received enough rain (Figure 12) and had a loamy soil. But at 1,376 m in elevation, minimum temperatures in Myanmar were on the cool side (Figure 10).
We ran correlation tests to find out which climate-related factors seem to have the most influence on dry matter. These results are shown in Table 6 in the appendix. Some of the most interesting findings are listed below:
- Biomass of legumes in general was much better correlated with soil temperature than with air temperature. In this trial, soil temperature was measured on site, whereas air temperature was measured some distance away from the soil. Also, soil temperature reflects conditions experienced by plant roots, which could be significant.
- Overall, the amount of legume dry matter correlated more closely with early- (months 1 and 2) than later- (month 3) season temperatures. An exception was lablab dry matter, which correlated best with month-3 minimum soil temperatures and maximum air temperatures.
- Rainfall appeared to be a more important factor for lablab and rice bean than for cowpea and jack bean. For lablab, biomass of dry matter was correlated with rainfall received early (month 1) but not later (months 2 and 3) in the growing season, suggesting the importance of rainfall for early-season establishment.
- GDD were strongly correlated with the biomass of dry matter produced by each legume.
3. Learn and work with farmers to adopt top-performing legumes
By the end of a legume evaluation trial, the best-performing species/varieties should become apparent. Hopefully farmer opinions will also have been received and noted. If farmers are not accustomed to growing legumes as GMCCs, the trial may have helped raise awareness.
In the above-mentioned trial, the small field plots served as excellent demonstration and teaching places. Farmers and staff learned how to set up small test plots, and the plots provided valuable extension-related opportunities (Figure 16).


The positive impact of a simple legume trial, in terms of human relationships and livelihood improvement, was exemplified at the Bangladesh site, as summarized by Patrick Trail below.
|
Before receiving a visit from an agricultural extension agent last year, Abdul Motin did not know about green manure/cover crops (GMCCs) and had never attempted to grow one. He was unaware that cover crops offer numerous soil-building benefits through nitrogen fixation, the addition of organic matter, weed suppression, and surface temperature reduction, and he likely would have been wary to give the concept a try on his valued piece of land—especially without the nudging of a trusted agriculturalist friend working with Mennonite Central Committee (MCC) Bangladesh. Enter the farmer-extension relationship, a key link in the agricultural value chain. This link connects research and farmers; most importantly, it connects farmers’ needs to those who do agricultural research. Leveraging ECHO’s regional field trials of different GMCCs last year, one very good agricultural extension agent was able to take the research to the farm. By working together, Abdul and ag extension agent Jahangir Alam were successful in many regards. They gathered data on various GMCC varieties, supplying ECHO with valuable information to be compiled and disseminated throughout its wider network (research); MCC Bangladesh improved its standing and credibility in the community through good work and an additional field demonstration site (extension); and Abdul learned a new approach for building up his soil fertility in a way that is practical and appropriate to his environment (farmer). At the conclusion of the field trials, Jahangir suggested to Abdul that as he planted his next round of crops in the field, he might try to add half his regular rate of nitrogen to see for himself the benefits the legumes had provided. Abdul did so, and found that the cauliflower he planted on the GMCC portion of the field grew just as well as usual, and that it grew better than those on the portion of the field not receiving GMCC treatment! A great reminder that growing better crops often starts with growing good relationships with people. |
Continue to dialog with farmers about how the legumes they saw in your trial could be integrated into their current practices and cropping systems. Follow-up trials and extension activities can help with this. See BPN 6 for information on intercropping, relay cropping, strip cropping, and ways to minimize competition of legumes with farmers’ main crops.
Conclusion
Legumes grown as GMCCs can help maintain and improve soil health. Success, however, depends on matching legumes with local growing conditions and with farmers’ needs and constraints. Numerous legume species exist; learning about the local context is key to deciding which legumes could potentially grow well in a given area. Factors such as climate requirements, soil preferences and growth habit are also important. Helpful resources (such as those mentioned in this document) can be consulted to learn about specific legumes. That knowledge can be confirmed through on-site evaluation of legumes in small field plots, involving farmers as much as possible. Taking the time to study and evaluate legumes, before choosing which ones to promote, will help increase farmers’ success with their use as GMCCs.
References
Cook, B.G., B.C. Pengelly, S.D. Brown, J.L. Donnelly, D.A. Eagles, M.A. Franco, J. Hanson, B.F. Mullen, I.J. Partridge, M. Peters, and R. Schultze-Kraft. 2005. Tropical Forages: an interactive selection tool., [CD-ROM], CSIRO, DPI&F(Qld), CIAT and ILRI, Brisbane, Australia.
Daryanto, S., L. Wang and P-A Jacinthe. 2015. Global Synthesis of Drought Effects on Food Legume Production. PLOS ONE 10 (6).
Ecocrop. 1993-2007. Food and Agriculture Organization of the United Nations.
Palm, C., H. Blanco-Canqui, F. DeClerck and L. Gatere. 2014. Conservation agriculture and ecosystem services: An overview. Agriculture, Ecosystems, and Environment, 187: 87-105.
Ssali, H. and S.O. Keya. 1983. The effect of phosphorus on nodulation, growth and dinitrogen fixation by beans. Biological Agriculture and Horticulture 1(2):135-144.
Zahran, H.H. 1999. Rhizobium-legume symbiosis and nitrogen fixation under severe conditions and in an arid climate. Microbiology and Molecular Biology Reviews 63(4):968-989.
Further reading
General information
- Green Manure Crops (TN 10)
- An Introduction to Soil Fertility (TN 57)
- Nutrient Quantity or Nutrient Access? A new Understanding of How to Maintain Soil Fertility in the Tropics (EDN 74)
- The Use of Green/Manure Cover Crops for Relay Cropping in Northern Thailand (AN 10)
- Vegetative and Agronomic Technologies for Land Husbandry (EDN 89)
- Roland Bunch, Five Years in Africa (EDN 131)
Techniques utilizing GMCCs
- A “2:4:2” Maize/Legume Intercropping Pattern (EDN 133)
- Conservation Agriculture in East Africa: An Update (EAN 1)
- Conservation Agriculture in Areas with High Rainfall (EDN 127)
- Use of Legume Cover Crops in Orchards or Plantations (EDN 46)
- Inoculation of Leguminous Crops and Trees (EDN 101)
- Cornell University website, Conservation Agriculture: Global Research and Resources
- Farooq, M. H.Kadambot, and M. Siddique (Editors). 2015. Conservation Agriculture. Springer International Publishing Switzerland
- Save and Grow, a book (available as a PDF download) on an ecosystem approach to sustainable agricultural intensification that encompasses CA
- Matusso, J.M.M., J.N. Mugwe, and M. Mucheru-Mana. 2012. Potential role of cereal-legume intercropping systems in integrated soil fertility management in smallholder farming systems of sub-Saharan Africa. Third RUFORUM Biennial Meeting, Entebbe, Uganda
Crop-specific information
- Cowpea: Spotlight on Multi-Purpose Varieties (EDN 122)
- Crotalaria juncea, a promising green manure crop for the tropics (AN 3)
- Lablab purpureus: A new Staple Crop for the Sudano Sahel (TN 73)
- Dolichos lablab: A Legume that Feeds People, Animals and the Soil (EDN 82)
- Further Support for the Use of Lablab in Dry Areas (EDN 119)
- Tephrosia: A Multipurpose Tree for Gm/CC, Soil Conservation and IPM (EAN 2)
- Cowpea: Living Mulch under Maize (EDN 123)
- Rice Bean – Vigna umbellata: Another amazing green manure/cover crop (EDN 83)
- Success with Velvet Bean in the Republic of Benin (EDN 43)
- Sesbania rostrata: A green manure production system for rice (EDN 75)
- Various Plant Information sheets for individual gm/ccs
- Fact sheets on many legume species available online through Grassland Species Profiles, Tropical Forages, Winrock (nitrogen-fixing trees), Ecocrop (FAO), and Feedipedia
Soil fertility, soil life and GMCCs
- Bunch, R. 2012. Restoring the Soil: A Guide for Using Green Manure/Cover Crops to Improve the Food Security of Smallholder Farmers. Canadian Foodgrains Bank
- Marjatta E., J. Mureithi and R. DerEilittä, Marjatta, Joseph Mureithi, and Rolf Derpsch. 2004. Green manure/cover crop systems of smallholder farmers: experiences from tropical and subtropical regions. Kluwer Academic Publishers.
- Anderson, S., S.G., B. Pound, and B. Triomphe. 2001. Cover crops in smallholder agriculture: lessons from Latin America. London: ITDG (Intermediate Technology Development Group).
- Hoorman, J.J. and R. Islam. Understanding Soil Microbes and Nutrient Cycling. Ohioline (Ohio State University Extension)
- Dick, W.A., and J.L. Hatfield. 2001. Sustaining soil fertility in West Africa: proceedings of a symposium sponsored by Divisions S-4, S-8, and A-6 of the Soil Science Society of America and the American Society of Agronomy: the papers were presented during the annual meeting in Minneapolis, Minnesota, 5-9 November, 2000. Madison, WI: Soil Science Society of America.
- Handbook for Integrated Soil Fertility Management, Africa soil health consortium. 2012. Edited by Thomas Fairhurst.
Economic Aspects
- Food and Agriculture Organization. 2001. The Economics of Conservation Agriculture. Rome, Italy.
- Food and Agriculture Organization. 2015. Economic Aspects of Conservation Agriculture. Rome, Italy.
- Francis R., P. Weston and J. Birch. 2015. The social, environmental and economic benefits of Farmer Managed Natural Regeneration (FMNR). World Vision Australia
Extension
- Modernizing Extension and Advisory Services (MEAS): a website with numerous publications and tools related to farmer extension
- ECHO MEAS Summaries: a collection of documents summarizing MEAS insights most relevant to ECHO’s network of field-based practitioners
APPENDIX

|
Table 6. Strength of correlation between legume biomass (of all four species) and temperature-related factors. |
||||||||||
|
All 4 legumes |
Cowpea |
Jack bean |
Lablab |
Rice bean |
||||||
|
Temperature-related factor |
CorrZ |
P valueY |
CorrZ |
P valueY |
CorrZ |
P valueY |
CorrZ |
P valueY |
CorrZ |
P valueY |
|
Min soil temp averaged over month 1 |
0.65137 |
<0.0001 |
0.77409 |
0.0086 |
0.87735 |
0.0009 |
0.65690 |
0.0391 |
0.76524 |
0.0099 |
|
Min soil temp averaged over month 2 |
0.65358 |
<0.0001 |
0.78801 |
0.0068 |
0.88512 |
0.0007 |
0.62917 |
0.0513 |
0.77763 |
0.0081 |
|
Min soil temp averaged over month 3 |
0.58690 |
<0.0001 |
0.61338 |
0.0593 |
0.74890 |
0.0127 |
0.81216 |
0.0043 |
0.62534 |
0.0532 |
|
Max soil temp averaged over month 1 |
0.64472 |
<0.0001 |
0.79993 |
0.0055 |
0.88324 |
0.0007 |
0.56095 |
0.0916 |
0.78590 |
0.0070 |
|
Max soil temp averaged over month 2 |
0.56799 |
0.0001 |
0.76387 |
0.0101 |
0.80373 |
0.0051 |
0.33760 |
0.3401 |
0.74294 |
0.0138 |
|
Max soil temp averaged over month 3 |
0.53668 |
0.0004 |
0.73925 |
0.0146 |
0.76574 |
0.0098 |
0.27209 |
0.4469 |
0.71880 |
0.0192 |
|
Mean soil temp averaged over month 1 |
0.65277 |
<0.0001 |
0.79385 |
0.0061 |
0.88699 |
0.0006 |
0.61036 |
0.0609 |
0.78246 |
0.0075 |
|
Mean soil temp averaged over month 2 |
0.62523 |
<0.0001 |
0.79975 |
0.0055 |
0.86676 |
0.0012 |
0.48034 |
0.1600 |
0.78293 |
0.0074 |
|
Mean soil temp averaged over month 3 |
0.66237 |
<0.0001 |
0.82073 |
0.0036 |
0.90367 |
0.0003 |
0.57774 |
0.0803 |
0.81136 |
0.0044 |
|
Min air temp averaged over month 1 |
0.21921 |
0.1045 |
0.78980 |
0.0008 |
0.74663 |
0.0022 |
-0.28333 |
0.3263 |
-0.08655 |
0.7686 |
|
Min air temp averaged over month 2 |
0.25598 |
0.0569 |
0.79488 |
0.0007 |
0.77101 |
0.0012 |
-0.21988 |
0.4500 |
-0.00356 |
0.9904 |
|
Min air temp averaged over month 3 |
0.11512 |
0.3982 |
0.71020 |
0.0044 |
0.62972 |
0.0158 |
-0.40509 |
0.1508 |
-0.27637 |
0.3388 |
|
Max air temp averaged over month 1 |
0.45769 |
0.0004 |
0.49681 |
0.0707 |
0.67055 |
0.0087 |
0.59143 |
0.0259 |
0.54259 |
0.0450 |
|
Max air temp averaged over month 2 |
0.39304 |
0.0027 |
0.07513 |
0.7985 |
0.30097 |
0.2957 |
0.86870 |
<0.0001 |
0.69084 |
0.0062 |
|
Max air temp averaged over month 3 |
0.48451 |
0.0002 |
0.47817 |
0.0837 |
0.66889 |
0.0089 |
0.66644 |
0.0092 |
0.61525 |
0.0192 |
|
Mean air temp averaged over month 1 |
0.35709 |
0.0069 |
0.67988 |
0.0075 |
0.75850 |
0.0017 |
0.21493 |
0.4606 |
0.18934 |
0.5168 |
|
Mean air temp averaged over month 2 |
0.51269 |
<0.0001 |
0.66380 |
0.0096 |
0.82206 |
0.0003 |
0.50738 |
0.0640 |
0.58646 |
0.0275 |
|
Mean air temp averaged over month 3 |
0.39139 |
0.0029 |
0.77711 |
0.0011 |
0.83645 |
0.0002 |
0.08867 |
0.7631 |
0.29310 |
0.3092 |
|
Rain accumulated over month 1 |
0.02462 |
.8571 |
-0.60433 |
0.0221 |
-0.45491 |
0.1022 |
0.62648 |
0.0165 |
0.46955 |
0.0903 |
|
Rain accumulated over month 2 |
0.02319 |
0.8653 |
-0.54218 |
0.0452 |
-0.42458 |
0.1302 |
0.45211 |
0.1046 |
0.52524 |
0.0538 |
|
Rain accumulated over month 3 |
-0.25015 |
0.0630 |
-0.51353 |
0.0604 |
-0.56661 |
0.0346 |
-0.08553 |
0.7713 |
-0.12198 |
0.6778 |
|
Rain accumulated over months 1 to 3 |
-0.04486 |
0.7427 |
-0.66360 |
0.0097 |
-0.55330 |
0.0401 |
0.48466 |
0.0790 |
0.41308 |
0.1421 |
|
Growing degree days (GDD) from planting to harvestX |
0.56583 |
0.0001 |
-0.08208 |
0.8217 |
0.89629 |
0.0004 |
0.75053 |
0.0124 |
0.75340 |
0.0119 |
|
GDD that had accumulated by month 1 |
0.65247 |
<0.0001 |
0.79236 |
0.0063 |
0.88617 |
0.0006 |
0.61306 |
0.0595 |
0.78104 |
0.0076 |
|
GDD that had accumulated by month 2 |
0.64477 |
<0.0001 |
0.80245 |
0.0052 |
0.88413 |
0.0007 |
0.55438 |
0.0963 |
0.78843 |
0.0067 |
|
GDD that had accumulated by month 3 |
0.64922 |
<0.0001 |
0.80774 |
0.0047 |
0.88939 |
0.0006 |
0.55851 |
0.0933 |
0.79476 |
0.0060 |
|
ZCorrelation (corr) strength was tested with Pearson correlation coefficients. A value of -1 indicates the strongest possible negative correlation. A value of +1 indicates the strongest possible positive correlation. |
||||||||||
|
YThe corresponding Pearson correlation coefficient is statistically significant if the P ≤ 0.05. |
||||||||||
|
XAt pod formation time, when above-ground biomass was collected and weighed. |
||||||||||
Cite this article as:
ECHO Staff. 2017. Selecting Legumes as Green Manure/Cover Crops. ECHO Best Practice Note no. 7.