Introduction
Measurement has always been a vital part of agriculture. Farmers measure crop yield by bushels, sacks, or baskets. Without measurements, they can’t plan, market their products, or make a living. Over many years of trial and error, the authors have come to understand that measurement is just as essential in agricultural development.
Plant With Purpose (plantwithpurpose.org) is a Christian nonprofit partnership working globally with smallholder farmers to address economic, environmental, and spiritual challenges. Measuring impact is central to our work, and we continually work to improve our methods. At Plant With Purpose, evaluation, monitoring, and learning are not add-ons to programming—they are fundamental. These functions guide real-time decisions, help us understand what’s effective and what isn’t, strengthen long-term impact, and ensure accountability to the communities we serve and our donors and partners as well. The budget for these efforts is not discretionary or optional; it is a core investment in the integrity, effectiveness, and ongoing improvement of our mission. Undermining this investment would mean undermining the quality and credibility of the work itself. In this article, we share a method we use to measure program impact — Difference-in-Differences.
What is difference-in-differences?
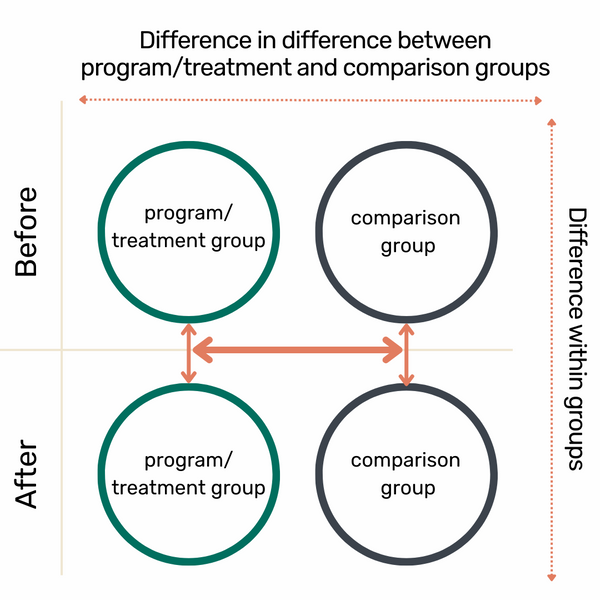
Figure 14. Visual explanation of Difference in Differences. Source: adapted from FAO, 2008.
Difference in differences (or diff-in-diff, or DID; Figure 14) is a key improvement we’ve made to our measurement practices in recent years. Previously, we measured the impact of our work by comparing two sample groups: participants in the program and non-participants, randomly selected from communities within the program area. This design, often referred to as a “naive” design (Newcomer et al., 2015), could show whether there was a difference between the sample groups—but it couldn’t tell us whether that difference was actually caused by the program itself or by other factors.
Selection bias is one major limitation of that design. Participants may appear to be better off simply because they were more motivated, better connected, or more economically stable to begin with. Without accounting for this, it’s easy to overstate a program’s true impact.
Baseline and endline surveys without a meaningful counterfactual 5are common, partly because of considerations like limited budgets, staffing, or technical capacity. However, the strength of a DID approach is that it provides a rigorous and relatively accessible way to approximate a counterfactual. By tracking changes over time in both (instead of just between) participant and comparison groups—ideally in matched or similar communities—we’re better able to isolate the effect of the program from broader trends, local shocks, or pre-existing differences.
We believe this shift toward credibly and feasibly incorporating a counterfactual, is not just a technical improvement. It’s a mindset change, reflecting a deeper commitment to honesty about what’s working. It ensures that claims of impact are based on something stronger than intention or correlation alone.
Benefits of DID
Using a DID approach to sampling has helped us improve our work in several ways:
Improved understanding of change over time: In the simpler design we previously used, we could measure differences between groups, but we couldn’t determine whether those differences were due to actual changes over time or were directly program-related. DID helps clarify when and where change is truly happening.
Clearer insight into spillover effects: With the DID approach, we can separate the influence of participants on non-participants within the same community. Participant farmers often share knowledge, resources, or practices that positively affect their neighbors. By including a group—outside the program area—we’re better able to identify and measure this kind of indirect impact. As a result, we’ve found that previous designs may have underestimated the program’s overall effect.
Greater credibility with partners and supporters: As donors and the broader public become more informed and discerning, there’s a growing emphasis on substantiating impact claims with robust evidence. This positive development aligns with our own values. A DID design equips us to meet this standard with confidence and clarity. It enhances transparency, strengthens trust, and positions our program as committed to ongoing learning and improvement.
Real-time evidence of mission impact: The DID approach provides timely, credible evidence of whether our programs achieve their intended results, allowing us to make informed adjustments and keep our work focused and aligned with our mission.
Challenges of DID
Logistical complexity: A DID design requires identifying two separate sampling areas—a treatment area where the program is implemented, and a comparison area where it is not. While conducting evaluations in the treatment area can be challenging, working in the comparison area often introduces even greater complexity. Communities not involved in the program may be unfamiliar with our work and, understandably, more hesitant to participate in data collection activities.
Resource intensity: Implementing a DID evaluation requires more resources than simpler designs. Because it involves data collection across two different sites and at two points in time (before and after), overall cost and coordination demands are significantly higher. This investment is meaningful, but requires careful planning and commitment.
Ethical considerations: Studying communities where the program has not yet been introduced presents unique ethical challenges. Unlike surveying non-participants within an active program area, working in comparison communities can raise concerns about fairness and transparency. To address this, we select vetted comparison areas identified as strong candidates for future programming. This approach not only respects the dignity and expectations of those communities but also improves the comparability of the data, since these areas share similar characteristics with those currently served.
Alternatives to DID
While randomized controlled trials (RCTs) have long been considered the gold standard for establishing causal impact (Banerjee and Duflo, 2011; Glennerster and Takavarasha, 2013), they are often costly, impractical, and ethically challenging in dynamic, community-led environments. Effective community-based interventions are often holistic, inclusive, and designed to evolve with community participation—making rigid randomization both difficult and potentially disruptive. RCTs often require artificial separation between treatment and control groups, which can be impractical or ethically inappropriate in community development contexts. DID, by contrast, allows us to track changes over time within naturally occurring groups. This makes DID a better fit for measuring impact in settings where community ownership, adaptive practices, and long-term change are core to what we consider success.
How to implement a DID evaluation
There are many excellent resources available on DID methodology and broader evaluation approaches (Newcomer et al., 2015; Gertler et al., 2016). The following are guidelines Plant With Purpose developed based on our experience conducting DID studies in real-world, community-based settings.
- Determine why, what, and how you want to measure: Before beginning a DID study, it’s essential to define why you are measuring, what you are measuring, and how you plan to measure it. Consider whether the goal is to improve program design, meet donor requirements, or track progress against a strategic plan. Identify the indicators you will use and the methods best suited to capture them (household surveys, interviews, participatory workshops, case studies, or mapping). This step may also help determine whether DID is the right fit. If so, the following steps provide practical guidance.
- Design evaluation tools: Household surveys are common in DID studies, but other methods, such as participatory workshops or spatial data collection,6
6For examples of participatory workshops see Flanangan (2015). Examples of spatial data include physical/environmental characteristics of a geographical area.can also be used. Whatever method is selected, tools must align with the goals set in Step 1. When using household surveys, thoughtful question design is especially important. Several resources provide guidance on how to design effective questions (Bradburn et al., 2004). For surveys requiring translation, translate and back-translate the content to ensure clarity. Pilot final drafts before full implementation.
We recommend using digital data collection tools. Digital platforms improve data quality, reduce costs, and minimize errors compared to paper-based tools. - Identify a comparison area and treatment area: The comparison area should be as similar as possible to the treatment area in terms of population, geography, and local economy. Perfect matches are rare. We have found that geographic proximity often serves as a reasonable proxy for similarity and makes for a practical approach.
- Determine sample size: If using household surveys, apply statistical methods to calculate the required sample size. This will depend on the precision needed and the expected effect size. Many tools are available to support this step, such as the “Sample Size Calculator” (2025).
- Draw a random sample: Random sampling of households reduces the risk of bias in a household survey; it is also one of the more challenging steps in the DID process. To reduce the amount of work and cost, we use a clustered sampling approach. List all communities in the sample area. Randomly select a portion of these communities and collect household lists from these selected communities. Program staff work with community leaders to create household lists. Use these lists to randomly select the households to sample in the survey. This process usually takes several weeks or months and should begin before the planned survey schedule.
- Identify and train surveyor or enumerator7 team:
7Enumerators collect, compile, and synthesize data conducted through surveys or field research within communities.Surveyors must be trained by someone familiar with the tool design. Training should take place shortly before fieldwork begins. Enumerators should be fluent in local languages, understand the survey tools, and have no direct involvement in the program. For participatory tools, a separate facilitation team may need its own training.
- Test survey quality: Survey teams should practice before full deployment. Include time for questions and feedback. Follow this with a field-based test to check comprehension and consistency.
- Monitor data quality during collection: Where possible, track the quality of data in real time. Digital tools make this easier. When issues arise, provide immediate feedback to the team to make in-field corrections.
- Clean the data: Once the data is collected, review the dataset thoroughly. While digital collection reduces many common errors, all datasets require a level of cleaning.
- Analyze the data: Use the indicators and questions outlined in Step 1 to guide your analysis. This might include basic descriptive statistics or comparisons between groups. We conduct our analyses using R statistical platform (R Core Team, 2024), and user-friendly tools like RStudio (Posit, 2025).
- Share findings with stakeholders: Once the data has been analyzed, share results with stakeholders including community members and program teams. Sharing and asking for feedback helps validate the findings and provide important context.
- Prepare and share a final report: Effective reporting matters. Prepare a final report that is useful and understandable for different audiences, including communities, donors, and internal staff. Strong communication ensures that findings are applied and trusted. Figure 15 shows an example of a visualization of DID results from Plant With Purpose programming in the DRC.
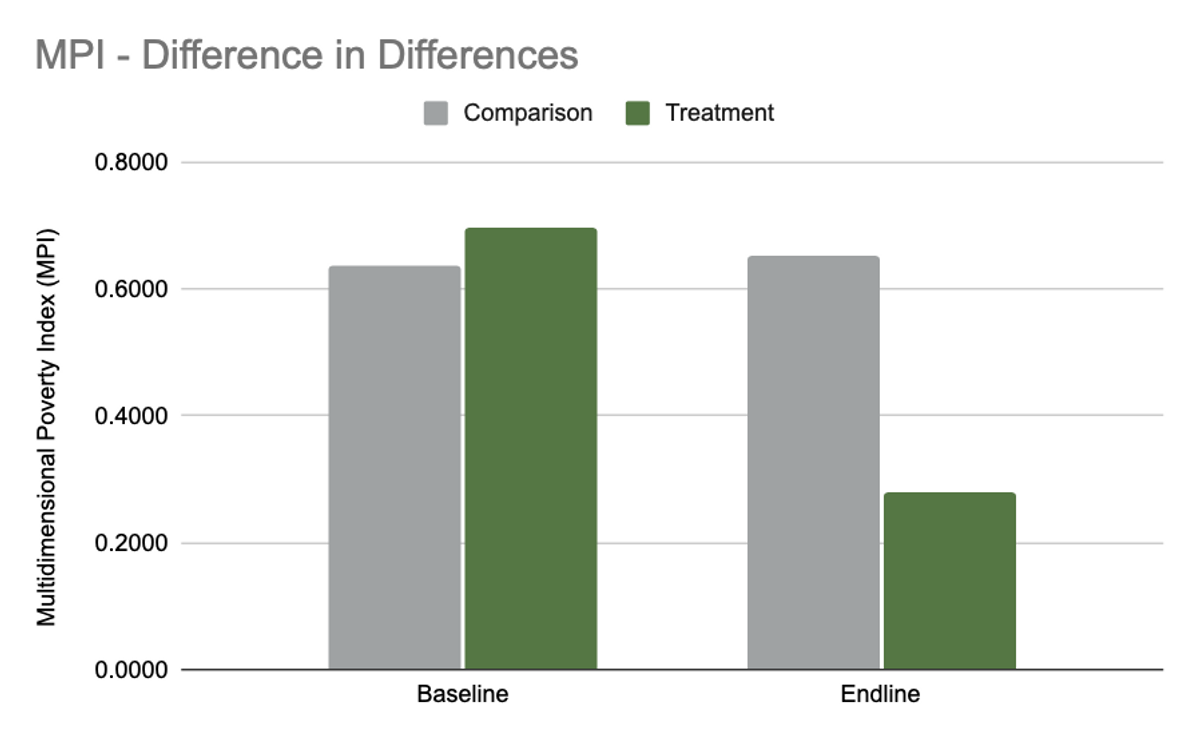
Figure 15. DID results of Plant With Purpose program in the DRC. Bar graphs show the change in Multidimensional Poverty Index (MPI) from baseline to endline, for a Treatment watershed and the Comparison watershed.
- Repeat for follow-up studies: If you are conducting a midline or endline study, repeat Steps 6 through 12. Consistency across timepoints is key to ensuring accurate DID calculations.
- Conduct the DID analysis: Once both baseline and follow-up data have been collected, calculate the DID using the following formula (GitHub, 2025):
DID = (T1-T0) - (C1-C0)
Where:
- T1 is the value in the treatment area after the intervention
- T0 is the value in the treatment area before the intervention
- C1 is the value in the comparison area after the intervention
- C0 is the value in the comparison area before the intervention
For example, if the indicator is the percentage of households applying green manures:
| Comparison | Treatment | |
|---|---|---|
| Before | 20% | 15% |
| After | 22% | 40% |
Then the difference in differences for green manure application would be,
(40-15) - (22-20) = 25 - 2 = 23
Which means that the rate of application of green manures increased in both the Comparison area (by 2%) and the Treatment area (by 25%), but the change of the Treatment over the Comparison is a change of 23%. If your sample size is sufficient, you can validate the result with a statistical significance test (e.g. T-test; ScienceDirect, 2020; Torres-Reyna, 2015).
Conclusion
Measurement has always played a central role in farming—and is equally vital in agricultural development. For us, adopting a difference-in-differences (DID) study design has strengthened our ability to detect change over time and to assess whether that change is likely the result of program activities.
While DID is more complex and resource-intensive than simpler evaluation designs, the investment has been worthwhile. It has provided clearer insights, stronger evidence, and increased confidence in the effectiveness of our work. For organizations focused on learning and accountability, this approach offers a practical way to better understand impact.
References
Banerjee, A.V. et E. Duflo. 2011. Poor Economics: A radical rethinking of the way to fight global poverty. Public Affairs.
Bradburn, N.M., S. Sudman, et B. Wansink. 2004. Asking Questions: The Definitive Guide to Questionnaire Design–for Market Research, Political Polls, and Social and Health Questionnaires. John Wiley & Sons.
FAO. 2008. IPM Impact Assessment Series. FAO Guidance Document.
Flanagan, B. 2015. Participatory methods and tools in community development. ECHO Summary of MEAS Participatory Methods documents.
Gertler, P.J., S. Martinez,P. Premand, L.B. Rawlings, C.M.J. et Veermersch. 2016. “Impact Evaluation in Practice - Second Edition.” Text/HTML. World Bank. https://www.worldbank.org/en/programs/sief-trust-fund/publication/impact-evaluation-in-practice.
GitHub, 2025. Difference-in-difference. https://ds4ps.org/pe4ps-textbook/docs/p-030-diff-in-diff.html
Glennerster, R., et K. Takavarasha. 2013. Running randomized evaluations: A practical guide. Princeton University Press. https://doi.org/10.2307/j.ctt4cgd52.
Newcomer, K., H. Hatry, H, and J. Wholey. 2015. Handbook of Practical Program Evaluation, 4th Edition | Wiley. https://www.wiley.com/en-ca/
Posit. 2025. “RStudio.” Posit (blog). 2025. https://www.posit.co/.
R Core Team. 2024. “R: The R Project for Statistical Computing.” 2024. https://www.r-project.org/.
“Sample Size Calculator.” 2025. https://www.calculator.net/sample-size-calculator.html.
ScienceDirect. 2020. “Difference-In-Differences - an overview | ScienceDirect Topics.” https://www.sciencedirect.com/topics/economics-econometrics-and-finance/difference-in-differences.
Torres-Reyna, O. 2015. “Difference in Differences (v3.3).” Princeton U. https://princeton.edu/~otorres/DID101.pdf.