This article is from ECHO Asia Note #27
Background
From September to November 2014, and again in July and August 2015, ECHO Asia made and tested an alternative herbicide using locally-available ingredients at the ECHO Asia Seed Bank, in Mae Ai, Thailand (See ECHO Asia Note 26: “Making and Testing an Alternative Herbicide for Smallholder Applications”), which proved effective for controlling weeds in an experimental area. The herbicide is composed of ripe papaya or pineapple, salt, and lye (which is quite alkaline). We wondered how the alkaline herbicide spray might affect soil pH, soil structure, plant health, and microbial population density. Other scientists have found agricultural inputs such as herbicides and fungicides can alter microbe populations. Because stability in soil microflora populations is crucial for processes such as nutrient cycling and soil aggregation, we wanted to monitor any potential changes to these beneficial organisms. However, because quantifying microbe populations is generally lab-intensive and expensive, ECHO Asia set about trying to re-create an appropriate, relevant, and useful protocol for determining changes to soil microbial population size.
Introduction
Microorganisms are defined as any living things too small for the eye to see; they include fungi, algae, and bacteria (Rao, 1995). These small organisms can be found everywhere: in water, air, and in the soil. On a farm, microorganism numbers are especially high in compost, manure, and the juice from IM (Indigenous Microorganisms; or juice from EM, Effective Microorganisms). Microorganisms are an important component of the soil; they help to decompose organic matter, while also making nutrients available to plants from rocks and air, and aiding in soil adhesion (Tisdall, 1994; Hayat et al., 2010). Soil microorganisms also play a critical role in keeping plants healthy, as they help with nutrient cycling, break down herbicides, and—if good microorganisms are in abundance—reduce bacterial plant diseases (Anderson, 1984; Mendes et al., 2011).
Microorganisms’ health and populations are influenced by a variety of factors including: soil pH, soil moisture content, temperature, salinity, oxygen content, and organic matter (Schnürer et al., 1986; Matthias et al., 1995; Graeme et al., 2008; Tourna et al., 2008). Farm inputs such as manure, compost, IM juice, fertilizers, fungicides, and pesticides may also affect the population size and the type of microorganisms that are present (Bünemann et al., 2005).
Microorganisms are most often found in the upper layers of soil, such as the topsoil and surface soil. This region is also the most likely to come into contact with herbicides, fertilizers, and pesticides, and with organic inputs like leaves, manure, compost, and IM juice. Most microorganisms prefer a pH of around 5-7 (a similar pH to water). Fluctuations in soil pH can change the community structure of soil microorganisms (Lauber et al., 2009). Tropical soils tend to be more acidic (a lower pH of 4-5 is typical), so organisms that prefer more acidic soils will colonize those areas. Microbes require carbon, oxygen, nitrogen, sulfur, potassium, magnesium, manganese, iron, and other ions in smaller amounts. Most of the necessary nutrients are obtained when microorganisms decompose dead material or eat each other. Microorganisms prefer porous soils high in organic matter, so that there is adequate food, water, and oxygen (Hassink, 1993).
Soil salinity is a measure of the quantity of salts in soil; these salts include sodium, magnesium, calcium, sulfate, and bicarbonate. Salt stress can lower a microbial population’s metabolic ability (Rietz & Haynes, 2003). Saltwater intrusion may happen in regions close to salt water marshes, brackish water, or the ocean. Additional changes in soil salt content can result from changes to the water table and the application of some fertilizers, both of which may decrease microbe health and populations.
Historical land use may also have lasting impacts on soil microorganism populations. Certain factors such as pH level, salinity, and pesticide residues can persist in the soil and may be difficult to change. So many factors impact the health of microorganism communities that it’s often difficult to narrow down the exact problem. However, it is still important to monitor microorganism populations on the farm, especially when trying out new techniques and technologies. This article describes different options for monitoring the relative number of microorganisms in the soil, as a lower-cost alternative to lab testing.
Microbial population density has been correlated to decomposition and soil respiration. The assumption is that a greater density of soil microbes, to a point, can cause the decomposition of organic matter more quickly than smaller populations of the same soil microbes. Previously, microflora population quantification over a period of time has been used as an indicator of soil pollutants (Van Bruggen & Semenov, 2000). Because nutrient cycling, which includes decomposition, is so important to soil quality, and these microorganisms aid in this process, we want to monitor changes in their population size in response to the new input. We are most concerned that the herbicide would harm the microorganisms and reduce their populations. This proxy would show such a reduction if the filter paper in herbicide sprayed plots rotted more slowly than in plots sprayed with the water control.
[Eds.’ Note: ECHO Asia used the following methods in order to test the effects of homemade natural herbicides. We compared pineapple herbicide, papaya herbicide, and used plain water as the control. For the readers’ reference, the experimental area was divided into nine 1m x 2m plots, the treatments (pineapple herbicide, papaya herbicide, or plain water) were randomized with 3 replications for a total of 9 experimental units, that is: 3 treatments x 3 replications), and each treatment was applied to a plot of weeds for 1 minute at 500ml/m2 . Please see ECHO Asia Note 26 for more information.]
Filter Paper Method
This first test method requires little hands-on time, but takes several weeks to run before results are obtained. It requires fewer resources than the second method, and can provide either qualitative or quantitative information. This filter paper method does not measure the number of microorganisms themselves, but rather the decomposition rate of organic matter by microorganisms. Microorganisms are necessary for decomposition, so there is a positive relationship between microorganism population and decomposition rate. As the populations of microorganisms responsible for decomposition increase, so does the rate at which the filter paper breaks down. (Other microhabitat factors such as temperature and soil moisture may also impact the decomposition rate.)
Materials:
• Filter paper (coffee filter, or lab filter paper such as Whatman)
• Litter bag or mesh bag (we used laundry bags intended for sock washing)
• Shovel
• Plot marker (this can be a flag, plastic ribbon, or even a simple stick)
• Measuring tape
Method:
1. Start with clean hands and a clean litter bag.
2. Weigh 1 to 3 pieces of filter paper and place them in the bag, making sure they are 1 layer thick

Figure 1: The filter paper method involves using filter paper inside a mesh bag, as photographed here.
and that they do not overlap (additional filter papers in the bag only give you additional subsamples) (Figure 1).
3. In each area or treatment plot you plan to monitor relative microbe populations, dig a hole that is roughly the size of the litter bag to a depth of 4-6 cm, making sure the bottom of the hole is flat.
4. Place the litter bag, with filter paper in it, on the bottom of the hole and backfill with the dirt you removed so it is level with the rest of the soil.
5. Mark the location so that you can find it again.
6. Let it rest for 6 weeks.
7. After 6 weeks, dig up the litter bag and compare the decomposition of the filter paper to that in other plots (this can be done visually, by making a visual estimate of which is most/least decomposed; for a more accurate measure see step 8).
8. For a more accurate measurement of decomposition rates, remove the filter paper from the litter bag and shake off the dirt (large clods of dirt stuck to the paper should be carefully scraped off). Dry the pieces of filter paper in an oven set to 60°C for 24 hours. Once completely dry, reweigh the filter paper. The following formula gives the final change in weight; a smaller percent decomposition indicates that less decomposition occurred, and a larger percent decomposition indicates that more decomposition occurred. We infer microbial health and populations from these numbers; a higher percent decomposition implies the presence of more microbes.

Bacterial Colony Count Method
Bacterial counts give numerical data in as little as 24 hours, and approximate the actual

Figure 2: Creating agar plates and counting bacterial colonies is the second method discussed in this article to indicate changes in soil system health.
microorganism population present in a sample (Figure 2). In addition to plant roots, macroarthropods, and microarthropods, microorganisms are part of the biological components of a soil system. Many labs utilize this method to analyze soil microbe population size as one indicator of changes to soil system health. This method involves more preparation time and requires more resources, but the results can be more accurate. Maintenance of a sterile working environment is crucial to this method’s accuracy.
Unlike most lab analysis, we made our own nutrient agar and incubated the petri dishes at a slightly lower temperature (27°C rather than the more standard 25°C or 30°C). This means that CFU counts from other labs or lab protocols would have slightly different CFU counts than what we obtained. However, the general patterns within the experiment over time—microbial populations increasing, decreasing or remaining neutral—should be similar to what other labs would find. Because bacteria and fungi are so diverse, their nutrient needs have different ideal proportions for each species and so no one type of nutrient agar can support all of the different types of microorganisms. Some species might need additional nutrients and other compounds to successfully multiply into a visible colony. Because of this, our nutrient agar can only support a fraction of the bacteria and fungi present in soil, but can still show general trends for the bacteria that can use it.
Materials:
• Trowel
• Jar/plastic sample bag
• 5 ml pipette (x 2)
• 20 ml test tube/small glasses (x 7)
• Agar plates (can be made; see below)
• Stirring rod
• Bacterial spreader
• Alcohol/flame
[Note: The scientific equipment—agar plates, test tubes, stirring rod and bacterial spreader—were purchased at Union Science, Suthep Rd., Chiang Mai, Thailand.]
Method:
1. Label 7 test tubes and 7 agar plates with “1, 10-1,10-2, 10-3, 10-4, 10-5, 10-6.” Sterilize them by soaking them in a solution containing 9 parts water and 1 part bleach for 24 hours, or place in a pressure cooker for 20 minutes at 121°C at a pressure of 103.4 kilopascals.
2. Fill tube 1 with 10 ml sterile water and the rest of the tubes with 9 ml sterile water.
3. Use a sterile trowel to collect a soil sample of at least 1 gram, and deposit into a sterile container.
4. Measure out 1 gram of the soil and add it to the 10 ml of purified water in test tube 1.
5. Mix well (using sterilized stirring rod if necessary, to break up clumps).
6. Use a sterile pipette to remove 1 ml of mud solution from test tube 1 and move it into test tube 10-1. Mix well.
7. Using the same pipette, remove 1 ml of mud solution from 10-1 and move it into test tube 10-2. Mix well.
8. Move 1 ml of solution from test tube 10-2 and transfer it to test tube 10-3. Continue in this

Figure 3: Creating the solutions for the serial dilution for the bacterial colony count method. Photo credit: technologyinscience.blogspot.com.
manner, following the numerical order, until all the test tubes have a solution in them (Figure 3).
9. Sterilize the bacterial spreader. You can pass it through a flame until it glows red and then allow it to cool, or wipe it down with 70% ethyl alcohol and allow it to dry.
10. Using the second sterilized pipette, move 0.5 ml of solution from test tube 10-6 onto agar plate 10-6
11. Use a sterilized spreader to spread the solution across the surface of the plate from edge to edge, turn the plate 90 degrees and

Figure 4: Spreading method for adding bacteria to the agar plates.
keep spreading, turn two more times for full coverage (Figure 4). Immediately re-cover the plate.
12. Re-sterilize the spreader, and then move 0.5 ml of solution from test tube 10-5 onto agar plate 10-5. Spread in the manner described in step 11.
13. Repeat steps 10 to 12 for the remaining test tubes/agar plates in numerical order, moving from 10-6 up to 10-1.

Figure 5: Examples of common problems that occur when streaking the plates. Both indicate problems of contamination or concentrations of bacteria that are too high. The photo on the left has a solid streak which makes it uncountable. The photo on the right shows colonies probably merged together, which is why some of the spots are so large.
14. Stack all the agar plates upside down and put them in the warming chamber for 24 hours at 27°C (ECHO Asia uses a seed germination chamber that we built, see this link [https://www.youtube.com/watch?v=k6lux5EVUuI] to a YouTube video explaining the process).
15. After the 24-hour incubation period, look for plates that contain 30-300 colonies, make note of the dilution, and count the number of distinctive spots (colonies) which may vary in shape, size and color (Figure 2). It is important to note that if the “colony” is just a solid line where you streaked it or after only 24 hours a “colony” takes up a large portion of the plate, then either the solution was not diluted enough or the tools used may be contaminated. Instead of an original cell making a single colony, there would have been many colonies that have grown together making it impossible to count properly (Figure 5).

CFU is an estimate of the number of viable (healthy) microorganisms in a given volume of sample. Each bacterial or fungal cell can divide itself and makes a visible colony. The CFU is typically represented as CFU/ ml. A higher CFU indicates the presence of more microorganisms than samples with a low CFU. Most in-lab serial dilutions of soil microorganisms result in counts between 104 - 1012 CFUs for a gram of soil, but what is considered normal varies widely. Please note that the method outlined here, although quantitative, does more to expose trends over time in one location than to provide a number that can be compared with soil from other locations. Also, note that the composition and population size of microorganisms in the soil varies by depth and location.diluted enough or the tools used may be contaminated. Instead of an original cell making a single colony, there would have been many colonies that have grown together making it impossible to count properly (Figure 5).
Regarding safety, it is important to note that it is possible to grow toxic/pathogenic bacteria/fungi using this method. To minimize this likelihood, do not sustain colonies at temperatures much higher than room temperature during the incubation period (especially avoid the 36 to 38°C range, to prevent the survival and replication of bacteria that typically reside in mammals).
Making the Agar Plates

Figure 6: Supplies used for making agar plates include sugar, bouillon cubes, agar powder, and water
Materials (Figure 6):
• 12 petri dishes
• 2 cups water
• 2 tablespoons agar powder
• 2 bouillon cubes
• 4 tsp sugar
• 1 flask that can hold double the volume of the liquid (for sterilization)
• 1 pressure cooker
• 1 thermometer (sterilized with bleach)
• Aluminum foil
Method:
1. Steam the plates in a pressure cooker for 20 minutes at 121°C and a pressure of 103.4 kilopascals, or soak in a bleach solution of 9 parts water and 1 part bleach for 24 hours.
2. Mix agar, bouillon, sugar, and water in a glass vessel that can hold double their volume. Microwave or heat over a stove until the mixture is completely dissolved. Swirl to make sure there is no undissolved solid left.
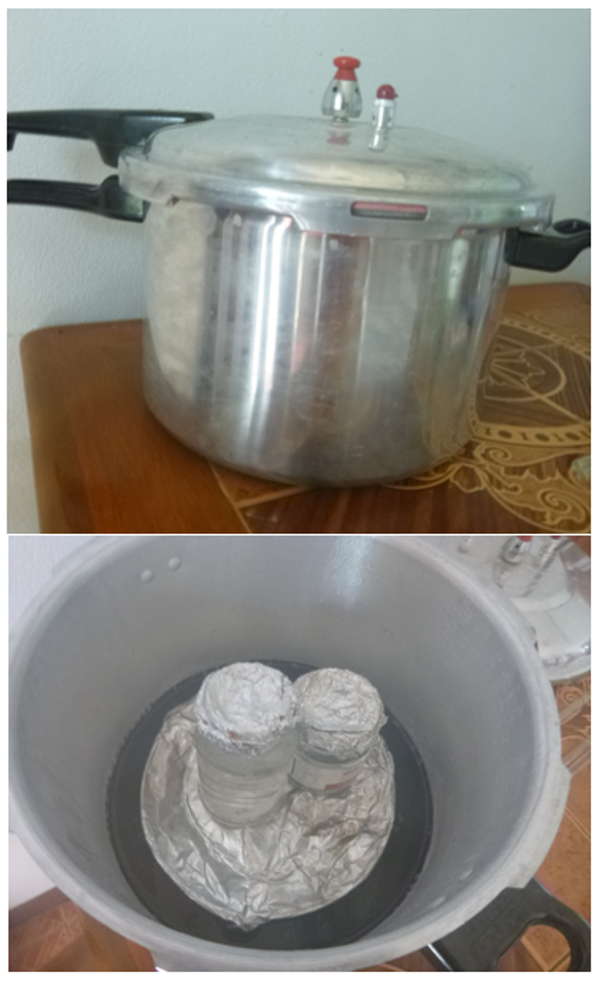
Figure 7: Stovetop pressure cooker used for sterilizing agar and other instruments. A trivet was placed into the pressure cooker and 2 to 3 cm of water was added to the bottom of the pot (so that it didn’t touch the bottom of the jars). Jars covered with foil were placed in the center, leaving at least 2 cm between the tops of the jars and the lid of the pressure cooker.
3. Cover the flask with aluminum foil and place it in the steam or pressure cooker. Following the manufacturer’s instructions, heat to 121°C and 103.4 kilopascals for 20 minutes (Figure 7).
4. Remove the flask from pressure cooker and wait until the temperature reaches 45°C.
5. Pour agar mixture into the bottom of each petri dish and ensure that the bottom is completely covered, but do not fill more than half full.
6. Immediately cover each petri dish with the lid and allow the agar to cool. Once the agar is solid, turn the plates upside down.
Alternative method if you don’t want to use the agar right away:
7. Follow steps 2 and 3 for the agar, but use a glass jar with a lid that has also been sterilized. After the agar has been sterilized, de-pressurize the pressure cooker and place the lid on the jar. The agar will solidify and can be stored for up to 1 week.
8. When you want to use it, place the jar full of agar in a bath of warm (not boiling water) until the agar melts/ reaches 45°C.
9. Follow steps 5 & 6.
Results
[Eds.’ Note: The primary purpose of this ECHO Asia Note is to present options for the ECHO Asia network to quantify and compare soil microbe populations to assess soil health, as a part of a larger experiment to test the effects of natural herbicides on weeds and soil health. We trialed these two methods to see how the trends in colony forming units in the ECHO Asia laboratory procedure compared to the filter paper microbial proxy and to CFU results from a professional soil analysis laboratory. ECHO Asia did not run enough replications on the trials to be statistically rigorous, only to see if in fact a resource-constrained NGO could utilize accepted laboratory procedures at a lower cost, in order to use as a proxy for determining soil microbial health. Therefore, while the data included below is numeric, the results should be understood as qualitative rather than quantitative; they can be used to compare treatments within the same experiment but not across multiple experiments, as the results are localized to the certain environmental conditions of our test plots. We still chose to include these results from the trials in order to share what we learned with network members before they attempt these methods themselves. We would love to hear of any experiences you have with either of these methods.]
When testing the filter paper method, we found that the filter paper was more sensitive to how long it was left in the soil than we had expected. Depending on the climatic conditions and other soil variables, the decomposition rate may vary. If you are using this method to conduct comparison trials or research for yourselves, we recommend that before trying to measure microorganisms in an experiment, you bury filter papers in your own soil and harvest them one by one over a period of weeks, to find out how long the papers last before completely disintegrating. You need to have something to measure and compare at the end so if it decomposes more that 90%, we suggest burying for a shorter amount of time. Once you get a framework for how long the filters will last in the soil, you can then conduct your trial or experiment.
|
Our experiments showed a slight discrepancy: both showed much variation in the soil microbial populations, and differing patterns in terms of which soils’ microbial populations remained similar or declined. The filter paper test suggested that there was no significant difference in the health of soil microorganisms in soil that received a water treatment, a pineapple herbicide, or the papaya herbicide (Table 1). Variation was higher within the treatments than it was between the treatments, especially for the plots treated with pineapple herbicide and the control plots. Although the sample size is too small to run statistics on, we observed that the filter paper buried under the soil treated with the papaya herbicide appears to have lost the least weight and decomposed more slowly than the paper buried in other soil treatments. This suggests that the soil microorganism populations may have declined more in the soil treated with the papaya herbicide than in the other soils.
|
In the CFU petri dish test, the variation of CFUs in the starting soil was just as great as the change in colony forming units, making a definite pattern difficult to distinguish. While microorganism populations declined with use of the pineapple treated herbicide, soil treated with papaya herbicide or with the control actually increased in number of microorganism populations (Table 2). Literature suggests there would be a decline in CFUs of less than 1.0 x 10⁴ from the starting colony counts if the herbicides negatively affected soil microbial health. We think the increase in CFUs for the papaya and control treatments may have been because the monsoon rains began during the trial, providing an increase in moisture. Further experimentation with increased replications of the herbicide trial could reveal whether the lack of a repeated pattern resulted from wide variability between plots, or whether there really is no difference for the two herbicide treatments on soil microbial health.
Conclusions
These tests can potentially help you evaluate the population size of microorganisms in your soil. Each soil has different properties and will also have different microorganism populations. These tests can be used before and after use of soil inputs or amendments, to evaluate their impact on soil health. They could also be used to compare soil from different locations on a farm, especially if you think something may be negatively affecting the microorganisms in a particular area. However, these tests can only tell whether or not there has been an impact; they cannot tell what factor(s) are causing the decline or increase in number of soil microorganisms. Typically, the healthier your soil, the more microorganisms will be present, contributing to a healthier production system.
[Note: Separate tests for soil moisture, soil texture, and pH can be found in ECHO Asia Note 15 “Soil Quality Assessment: Why and How” by Marcia Croft.]
Literature Cited
Anderson, J. P. E. (1984). Herbicide degradation in soil: influence of microbial biomass. Soil Biology and Biochemistry, 16(5), 483-489.
Bünemann, E. K., Schwenke, G. D., & Van Zwieten, L. (2006). Impact of agricultural inputs on soil organisms—a review. Soil Research, 44(4), 379-406.
Hassink, J., Bouwman, L. A., Zwart, K. B., & Brussaard, L. (1993). Relationships between habitable pore space, soil biota and mineralization rates in grassland soils. Soil Biology and Biochemistry, 25(1), 47-55.
Hayat, R., Ali, S., Amara, U., Khalid, R., & Ahmed, I. (2010). Soil beneficial bacteria and their role in plant growth promotion: a review. Annals of Microbiology, 60(4), 579-598.
Lauber, C. L., Hamady, M., Knight, R., & Fierer, N. (2009). Pyrosequencing-based assessment of soil pH as a predictor of soil bacterial community structure at the continental scale. Applied and Environmental Microbiology, 75(15), 5111-5120.
Mendes, R., Kruijt, M., de Bruijn, I., Dekkers, E., van der Voort, M., Schneider, J. H., Piceno, Y.M., DeSantis, T.Z., Anderson, G.L., Bakker, P.A.H.M & Raaijmakers, J. M. (2011). Deciphering the rhizosphere microbiome for disease-suppressive bacteria. Science, 332(6033), 1097-1100.
Nicol, G. W., Leininger, S., Schleper, C., & Prosser, J. I. (2008). The influence of soil pH on the diversity, abundance and transcriptional activity of ammonia oxidizing archaea and bacteria. Environmental Microbiology, 10(11), 2966-2978.
Noll, M., Matthias, D., Frenzel, P., Derakshani, M., & Liesack, W. (2005). Succession of bacterial community structure and diversity in a paddy soil oxygen gradient. Environmental Microbiology, 7(3), 382-395.
Rao, N. S. S. (1995). Soil Microorganisms and Plant Growth (No. Ed. 3). Science Publishers, Inc.
Rietz, D. N., & Haynes, R. J. (2003). Effects of irrigation-induced salinity and sodicity on soil microbial activity. Soil Biology and Biochemistry, 35(6), 845-854.
Schnürer, J., Clarholm, M., Boström, S., & Rosswall, T. (1986). Effects of moisture on soil microorganisms and nematodes: a field experiment. Microbial Ecology, 12(2), 217-230.
Tisdall, J. M. (1994). Possible role of soil microorganisms in aggregation in soils. Plant and Soil, 159(1), 115-121.
Tourna, M., Freitag, T. E., Nicol, G. W., & Prosser, J. I. (2008). Growth, activity and temperature responses of ammonia-oxidizing archaea and bacteria in soil microcosms. Environmental Microbiology, 10(5), 1357-1364.
Van Bruggen, A. H. C., & Semenov A. M. (2000). In search of biological indicators for soil health and disease suppression. Applied Soil Ecology 15 (1), 13-24.