Soil quality, also known as soil health, is the capacity of the soil to function – how well it fills the roles we need it to, whether in a natural or managed ecosystem. A variety of measures are used to gauge soil health; although we can use these characteristics as indicators of soil quality, ultimately soil quality is judged by how well it fulfills its functions. Many indicators require complicated and technical lab testing, but others can be carried out with locally available materials. Learning about your soil can be a good way to identify appropriate crops for your setting or to look for potential problems.
Soil is a complex matrix of inorganic (mineral) particles, non-living organic (comprised of carbon) particles, air, water, and living biota. Soil functions generally fall into five categories: sustaining biological diversity and productivity; regulating water and solute flow; filtering and degrading organic and inorganic matter; cycling nutrients, such as nitrogen and carbon; and providing stability and support. Soils are evaluated in terms of both dynamic and inherent soil qualities-those that vary and those that do not vary based on use (respectively).
Understanding the many organic and inorganic parts that make up the soil can help us develop healthy, productive soil that fills our needs. At the ECHO Asia Seed Bank, we use a number of production plots with very different site histories, and we were interested in comparing the relative strengths and weaknesses of each plot, both to determine what crops these sites may be best suited for and to learn how to improve the soils present in them.
Figure 1. Typical soil horizons found in most soils
Soils have many layers, called horizons. Geological, chemical, and biological processes create these horizons. Most soil types will have between three and four distinct horizons. In general, the older the soil, the more distinct the horizons become. However, in some older tropical soils with high annual precipitation, very few soil horizons are expressed. Horizons generally follow a pattern of O-A-B-C-R from top to bottom within the soil profile: the O horizon is composed of organic matter; the A horizon is decomposed organic material (or ‘humus’); the B horizon (or subsoil) contains minerals leached from above; the C horizon is made up of large shelves of unweathered rock; and the R horizon is the bedrock (Figure 1). In tropical soils, if horizons are expressed, the A horizon is often missing or minimal.
This Research Note describes various techniques for soil sampling for a range of needs and technical capacities. Specifics are given on testing bulk density, soil moisture, pH, and soil texture. These tests cannot compare with testing done in a soil laboratory, which can sometimes be expensive but will give much more accurate results. However, these tests can be used to compare between plots and they are flexible and easily adapted to varying resource constraints.
A General Guide to Soil Sampling
Figure 2. Soil corer for soil sampling (fabricated in a machine shop in Chiang Mai)
The best tool for soil sampling is a soil corer; this is essentially a metal rod with a section cut out to allow for soil removal, with two handles at the top to allow it to be pushed into the ground. Soil corers come in all lengths and sizes, but a narrow diameter (about 2 cm/0.8 in.) allows small but deep samples of soil to be taken without disturbing the sampling plot. The cutaway section (Figure 2) allows soil to be easily removed and a standardized volume to be sampled from each plot of interest. Although these are expensive to buy in North America (about $200 US), replicas can be easily built for much less. (At the ECHO Asia Seed Bank in Thailand, we had one made at a machine shop for about $8 US). Without a soil corer, soil sampling can be done with a spade and a ruler by digging out a standardized volume and depth, or with a section of PVC pipe marked off at appropriate intervals (Figure 3).
Figure 3. Close-up of soil corer showing depth markings
Whether you want to sample an entire field or one raised bed, it is important to take a representative sample of your soil. The soil corer will help obtain a cross-section of the soil profile while only removing a small amount of soil. The depth of the sample will depend on the hardness of the ground. A minimum of 10 cm is best, although the deeper the better (as plant roots typically grow much deeper). Try to take at least four subsamples or replicates from the edges and middle of your plot. If the ground is compacting excessively when you push the soil corer in, do not to go too far past the depth of your sample (e.g. 10 cm/4 in.), as the soil below will compact and reduce the reliability of your measurements. The volume of soil you need will be determined by the number and kinds of tests you want to run. (For our testing at the seed bank, four subsamples at 10 cm were enough to complete all of these tests with soil to spare.) It is usually easier to sample in the morning, as the ground is softer and somewhat moister. If you do more sampling than can be completed in one day, try to sample at the same time each day to minimize error. While in the field, storing sampled soil in Ziploc bags will help minimize water loss, if this is important for your testing.
Once you have attained the complete number of samples from your plots, you can combine subsamples/replicates through sieving. Pushing the soil through a wide (about 1 cm/0.4 in.) wire sieve can help create a more homogenous sample from the subsamples you took. A sieve is not necessary, but do make sure replicates are adequately mixed together before you start testing.
Soil Texture
Figure 4. Soil texture influences soil characteristics in many ways
Soil texture refers to the relative sand, silt, and clay composition of your soil and can be tested by either of the two methods listed below. The first is somewhat more qualitative, but requires much less time than the second. The soil texture can tell you about the non-organic parts of your soil: the rock particles that provide structure for plant roots as well as nutrient-holding capabilities of your soil. Soil particles can be divided into categories based on their size: sand (2.0 - 0.05 mm), silt (0.05 - 0.002 mm), and clay (<0.002 mm). Soil texture is one of the most stable characteristics of soil, and influences a great number of soil characteristics (Figure 4). Although it is one of the most difficult properties to change, certain plants will do better with certain soil types, so this information can also be helpful in matching crops to the soil for which they are best suited. Soil type determination can also help provide insight into matching soil improvement strategies to a particular site through use of green manure cover crops and soil amendments.
Figure 5. Flow diagram for helping to determine soil texture class
Source: Thien, S. 1979. A flow diagram for teaching texture-by-feel analysis. Journal of Agronomic Education 8: 54-55.
Sample Procedure 1 (Soil Ribbon Test)
For this test you will need:
Your soil sample
Water
Follow the directions on the flow chart in Figure 5:
Sample Procedure 2
For this test you will need:
Your soil sample
Water
A ruler
A clear, straight-sided container with a fitted lid
A volume measuring device, such as a graduated cylinder or marked measuring cup
Take approximately 100 ml (3.4 US oz.) of soil from your sample and add to your container.
Add 150 ml (5.1 US oz.) of water and shake vigorously for at least 60 seconds.
Let container sit for about 1 week. Layers in the soil will start to show up before then, but they are easiest to discern after at least 5 days.
Figure 6. Separated layers of soil particles settled in water
The top layer that settles out will be clay, followed by silt and sand (Figure 6). Using a ruler with cm markings, measure from the top of the waterline to the top of the soil, the top of each subsequent layer, and the bottom of the container. Still holding it upright and trying not to disturb the settled layers, rotate the jar 90° and measure again, repeating until you have four measurements for each soil layer. It’s not essential to have four measurements, but sometimes the layers do not settle out evenly and it is best to take an average.
Calculate the thickness of each layer and average this across all four measurements for each layer. Then calculate the percentage of clay, silt, and sand in your soil sample.
Using the chart below (Figure 7), determine your soil texture. The example provided (darker lines labelled A, B and C) is for a soil that is 57% sand, 15% clay, and 28% silt – a sandy loam soil that falls within the circle of desirable soil texture types.
Soil Moisture Content and Bulk Density
Soil moisture content tells you the amount of water present in the soil, which can indicate how well the soil is being watered as well as how much moisture plant roots can access at the depth of the samples you took. Some soils appear damp at the surface, but the moisture does not penetrate well, so testing soil moisture can be a good way to examine differences between soils.
Bulk density, a measure of soil compaction, is easily evaluated in conjunction with soil moisture. Bulk density reflects the soil’s ability to provide structural support, soil aeration, and water and solute movement; it will depend on soil texture as well as crop management practices. Loose, porous soils with lots of organic matter will have lower bulk density, though this will naturally increase with the depth of the sample, as you move from one soil horizon into another. Bulk density is calculated by dividing the dry weight of the soil by its volume.
For this test you will need:
Your soil sample
A fairly accurate scale; at least one decimal place is very helpful
An oven or other reliable heat source
An accurate volume measuring device, such as a tablespoon
Ideal bulk density will depend on the soil type (see Table 1). However, a bulk density that is too high will restrict water and solute movement, and will limit the ability of the soil to provide structural support. High bulk density can be lowered by decreasing soil disturbance (e.g. avoid walking over planting beds), adding organic matter, and using multi-crop rotational systems that break up large aggregates.
Take a minimum subsample of 1 Tablespoon (approx. 15 cm3) from your total sample. Record the volume you use.
Weigh the soil subsample (with its latent soil moisture) to the greatest degree of accuracy possible, then place on a tin ‘weighing boat’ or other container that can withstand high heat.
Place in oven and leave at 100°C (212°F) until the mass of the sample stops decreasing, usually about one hour.
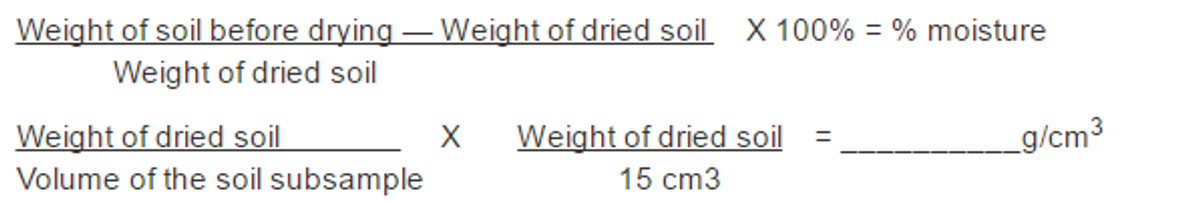
Weigh the dried soil. Calculate soil moisture and bulk density according to equations below.
To calculate soil moisture:
In this case, we use 15 cm3 as the volume of 1 Tablespoon, but if you use a different measure of volume, you will need to substitute your own value. Keep in mind that weight is also sometimes referred to as mass.
Soil pH
Measuring soil pH will tell you the acidity or alkalinity of your soil. The pH scale is a logarithmic scale, so the concentration of hydrogen (H+) ions will be 10 times higher in a solution with a pH of 3 than in one with a pH of 4. Hydrogen ions accumulate in the soil over time, lowering the pH. They come from a variety of sources but are usually a product of respiring plants and decaying organic matter. Lower pH indicates higher acidity. Solutions with a pH of 4.5-5.5 have been shown to have harmful effects on plants. Soil pH also affects nutrient availability for plants. Although a healthy soil pH can range from 5.5 to 8.0, a slightly acidic soil (6-7) is best for most plants. Certain plant species do better in slightly acidic or slightly alkaline soil, so this information can be used to appropriately match crop species to production plots. When soils become exceptionally acidic (e.g. less than 5.5), amending the soil with lime will help raise the pH. Overly alkaline soils (an uncommon occurrence) will generally decrease in pH over time as plants continue to respire and decay.
Figure 8. pH strips for determination of pH
For this test you will need:
Your soil sample
pH test strips, similar to those pictured in Figure 8
Distilled/pure water
Some kind of very fine filter, such as a coffee filter or tea bag
Sample Procedure
Mix equal parts water and soil, then thoroughly combine.
Filter the mixture, using a coffee filter, tea bag, or other filter.
Quickly dip pH strip into solution and compare the color of the test strip to the provided scale.
Conclusion
These tests can help you gain a better understanding of some of the physical properties that contribute to soil health. By measuring soil texture, moisture, bulk density, and pH, you will hopefully gain a picture of how your soil is doing. Over time, you can observe changes in the way the soil responds to management practices. If appropriate and available, you may want to follow up with testing by a professional laboratory for more information.
Of all soil management practices, adding organic matter has the most wide-ranging impacts. Increasing organic matter will improve aeration, water holding capacity, and nutrient holding capacity, while also raising the pH, lowering bulk density, and adding critical nutrients to the soil as it decays. For long-term agricultural productivity, attention must also be paid to soil life, particularly the role that soil organisms play. Such soil life includes microorganisms (e.g. bacteria, fungi, yeasts, protozoa), mesofauna (mites, springtails, etc.) macrofauna (earthworms and beetles) and megafauna, (rabbits and moles).
For more about soil life seeEDN 96. The article “Soil: A Fresh Look at Life below the Surface” by Danny Blank, former ECHO Farm Manager, takes a fresh look at what is going on in the soil, especially in relation to soil organic matter and the organisms it supports; how this life in the soil is impacted by our land care practices; and how it in turn impacts the productivity of our farms.
Another helpful resrouce, the USDA’s Soil Biology Primer, is an introduction to the living component of soil and how it contributes to agricultural productivity, and air and water quality. The Primer includes units describing the soil food web and its relationship to soil health, as well as units about bacteria, fungi, protozoa, nematodes, arthropods, and earthworms.
The soil quality assessment procedures outlined here are only a start. Many more resources are available online (some of them listed in the next section) that can explain more about soil properties and about improving soil quality through effective management.