VITA 1600 Wilson Boulevard, Suite 500 Arlington, Virginia 22209 USA Tel: 703/276-1800 * Fax: 703/243-1865 Internet: pr-info@vita.org
in cooperation with The Committee on Science and Technology for Developing Countries (COSTED) Central Leather Research Institute Adyar, Madras 600 026 India
This publication is one of a series issued by VITA to document the activities of its worldwide Renewable Energy Program.
ISBN 0-86619-167-4
Composed and produced in Arlington, Virginia, by VITA, Inc.
[C] 1983, Volunteers in Technical Assistance, Inc.
Table of Contents
Preface
Abbreviations and Terminology
Introduction
I. Rural Energy Consumption and Biogas Potential
II. An Overview of Biogas Systems
III. Digester Designs
IV. System Operation
V. Gas Distribution and Use
VI. Economic Analysis of a Village System
VII. Village Utilization
VIII. Conclusions and Recommendations
Notes
Appendix
Bibliography
Preface
An important common theme underlies much of the current literature on the application of technology within both developed and developing nations. Any technology has a complex series of impacts on the environment in which that technology operates. The concern over a technology's "appropriateness" is based on the need to determine clearly who will be affected by use of the technology and in what ways.
Behind the concept of "appropriate technology" is the belief that the complex interactions between a technology and its environment should be made "visible." Only then can a technology be evaluated properly. By describing explicitly the impact of a technology, the selection criteria for the technology also become explicit. If we choose a technology that pollutes a river, but which also provides permanent jobs for 10,000 workers, we presumably either value employment benefits over environmental costs or else were ignorant of the pollution effects at the time we made the decision.
The choice of a technology is "appropriate" or "inappropriate" only in the context of the demands we place upon it. The subtle trade-offs between these often conflicting demands are at the real core of any debate over the choice of a technology. Appropriate technology is less a problem of hardware than of appropriate data collection, decision-making, financing, installation, and use--with all the problems of sorting out competing demands and value judgements in each of these tasks.
This study is an assessment of the "appropriateness" of biogas technology in meeting some of the needs of India's rural population. Such an assessment is quite complicated, despite claims that a biogas system is a simple village-level technology. While there is evidence that biogas systems have great promise, they are subject to certain constraints. It is impossible to describe here all the factors that one might study to assess any technology. I only hope that the approach used in this study will help others.
One difficulty in studying biogas technology is the fragmented and often anecdotal nature of the research and development work. In order to provide this snapshot of the state-of-the-art in India, I have had to enlist the aid of a bewildering number of government officials, industrialists, university researchers, missionaries, social workers, journalists, voluntary groups, farmers, merchants, and villagers. While I will never be able to express fully my gratitude to the hundreds of people who have helped me piece this puzzle together, I am particularly indebted to the following: Dr. A.K.N. Reddy, and the ASTRA team, Indian Institute of Science, Bangalore; K.K. Singh, PRAD, State Planning Institute, Lucknow; Dr. Ram Baux Singh, Etawah; T.R. Satishchandran, Energy Adviser, Planning Commission, Government of India; Dr. S. Shivakumar, Madras Institute of Development Studies; Dr. C.R. Muthukrishnan, IIT, Madras; John Finlay and David Fulford of Development and Consulting Services, Butwal Technical Institute, Butwal, Nepal; D. Kumar and M. Sathianathan, Center for Science for Villages, Wardha; Dr. C.V. Seshadri and Rathindranath Roy, Murugappa Chettiar Research Centre, Madras; C.R. Das, Coordinator, Tata Energy Research Institute, Bombay; and the staff at the Central Leather Research Institute, Madras, all of whom were extremely helpful, generous, and patient with a stranger in a strange land.
I am extremely grateful to Dr. S. Radhakrishnan, Scientific Secretary of the Committee on Science and Technology in Developing Countries (COSTED), Indian Institute of Technology, Madras, for his constant trust and financial support throughout the course of my research. John Westley and the staff of the U.S. Agency for International Development (USAID), New Delhi Mission, provided both editing and typing assistance, as well as a research grant (USAID/India Purchase Order IN-P-O-67). The staff of Volunteers in Technical Assistance (VITA) spent many long hours editing the final manuscript and bringing it out in its present form. Of course, the views expressed in this study are my own, and do not represent the official position of VITA, USAID, the U.S. Government, or any other body.
Finally, I am deeply indebted to Dr. Y. Nayudamma, Distinguished Scientist, Central Leather Research Institute, Madras. without his guidance, friendship, and unyielding support, none of this would have been possible. All of these individuals have immeasurably deepened my understanding of biogas technology, as well as of India itself. Any errors or omissions contained in this study are due to my own failure to utilize their considerable insights.
Robert Jon Lichtman December 1982
Abbreviations and Terminology
BHP = brake horsepower
crore = 10,000,000 rupees
hr = hour
kcal = kilocalorie (1,000 calories)
kwh = kilowatt-hour
lakh = 100,000 rupees
[m.sup.3] = cubic meter
MT = million tonnes
MTCR = million tonnes of coal replacement
Rs = Indian rupee(s)
tonne = metric ton (1,000 kg)
Rs 1.00
US$0.125 at the time of this study
Introduction
The term "biogas" system is somewhat of a misnomer. Though biogas systems are often viewed as an energy supply technology, the Chinese regard their systems primarily as a means to provide fertilizer and the sanitary disposal of organic residues. Gas is considered a useful by-product.(1) In India, interest in biogas is due to its potential as a fuel substitute for firewood, dung, kerosene, agricultural residues, diesel, petroleum, and electricity, depending on the particular task to be performed and on local supply and price constraints. Thus, biogas systems provide three primary products: energy, fertilizer, and waste treatment. For the sake of convenience, the term "biogas system" in this study will refer to the technology of digesting organic wastes anaerobically to produce an excellent fertilizer and a combustible gas, and to dispose of agricultural residues, aquatic weeds, animal and human excrement, and other organic matter.
While use of biogas systems is not restricted to rural areas, the difficulties of retrofitting such systems in urban areas, supplying a balanced charge of biomass, generating adequate pipeline pressure, and minimizing capital costs all suggest that biogas systems will be more easily adapted, in the short term, to rural areas. This study therefore is focused on rural utilization of biogas systems.(2) I. Rural Energy Consumption and Biogas Potential
Biogas has great potential for supplying energy for cooking, lighting, and small-scale industry in rural India. This section will show through a series of calculations that biogas theoretically can play a significant, if not major, role in meeting many of these needs, as well as in supplying fertilizer and helping to solve other development problems. Readers not interested in these calculations should skip to Section II on Page 11; the important point is that biogas holds considerable promise and deserves further study.
To assess properly the potential of biogas systems for meeting a variety of rural needs, one would have to know the total amount of organic material (biomass) available annually; that is, material for which there are no other more productive uses. Biomass that could be employed as feed material would have to be studied carefully with respect to the annual output of each material, the average biogas yield per unit of material, collection and transportation costs, and the availability of the material over time.
Unfortunately such data do not exist in India with any degree of reliability. No accurate data exist on the annual supply of water hyacinth, congress grass, banana stems, and other biomass that can serve as a feed material to a biogas system.
Since many agricultural residues are used as fodder, knowledge of the net availability of these residues is important to avoid conflicting demands on their use. Statistics on the amount of residue per crop, though available, tell nothing of the end use of the residue. Revelle cites aggregate figures of 34-39 MT of crop residues consumed annually as fuel.(3)
Even annual dung output is a matter of some controversy. Desai estimates that out of the 114-124 MT (dry weight) of dung produced annually, about 36 MT dry weight are burned as fuel.(4) The Working Group on Energy Policy calculates that 73 MT of dung are used as fuel,(5) without specifying if this is a dry weight figure (dry weight = approximately 1/5 of wet weight). Revelle uses a World Bank estimate of 68 MT burned as fuel (out of a total of 120-310 MT) and suggests that 83 percent of this, 56 MT (dry weight), is consumed in rural areas.(6)
The Indian Ministry of Agriculture offers data on livestock Population and dung voided per animal per annum as shown in Table I-1. Again, there is uncertainty about the percentage of dung produced in rural areas. To be conservative, we will assume that there are roughly 237.5 million cattle, buffalo, and young stock (from Table I-1), and that their collectible daily yield from night droppings (when cattle are tied up near a dwelling) is approximately 8.0 kg per head.(7) Using Revelle's estimate of rurally produced dung at 83 percent of the total, annual rural dung production would be over 575.6 MT wet weight, or 115.1 MT dry weight.
Various estimates shed little light on the percentage of dung collected, or on factors affecting dung output, such as cattle species, body weight, diet, etc. Data will also vary regionally and seasonally. If we assume that there is a 20 percent weight loss during collection of the 115.1 MT dry weight of rural dung (calculated above), then the net available dung is 92.1 MT. To this can be added 34 MT dry weight of crop residues that are burned annually. This gives a total of about 126 MT (dry) of biomass that is available for biogas systems. Assuming an average gas yield of 0.2 [m.sup.3]/kg (dry) for the biomass(8) and a calorific value of 4,700 kcal/[m.sup.3] for biogas(9), the available biomass would yield roughly 25 billion [m.sup.3] for biogas. This is
Table I-1 Potential Annual Availability of Dung (1972)(10)
Annual Number of Daily Output/hd. Total Animals Output/ (millions (millions Livestock (Millions) Head (kg) of tonnes) of tonnes)
Cattle 131.4 10 3.65 479.6 (3 + years old)
Buffalo 37.8 10 3.65 138.0 (3 + years old)
Young stock 68.3 3.3 1.20 82.0
Sheep and goats 108.4 1.1 .4 43.4
TOTAL 743.0 Total = 743 MT (wet weight)
Total minus 20 percent collection loss = 594.4 MT (wet weight) = 118.9 MT (dry weight)
equivalent to 118 trillion kcal. This estimate probably is low, because it does not include numerous weeds and aquatic biomass that might be used as a feedstock for biogas plants, but which currently have no alternative uses.
Assuming biogas burners have a thermal efficiency of 60 percent, the potential net energy for cooking from biogas is roughly 71 trillion kcal per annum. Approximately 975 trillion kcal are currently consumed during the burning of dung, firewood, charcoal, and crop residues for domestic use (cooking, water heating, etc.).(11) Of that figure, 87 percent is used in cooking.(12) Therefore, approximately 848 trillion kcal per annum is consumed in cooking in rural India. This figure, when combined with a 10 percent average thermal efficiency of "chulahs"(13) (mud/clay stoves) and the vast number of open cooking fires, gives a net energy consumption of approximately 85 trillion kcal per annum for cooking. We will assume that rural cooking needs consume about 85 percent of this figure, so that the annual net energy consumption for rural areas is 72.3 trillion kcal. Thus, biogas can essentially provide the net usable energy currently consumed in cooking from all noncommercial fuel sources in rural India.
The amount of total solids in biogas slurry prepared from 126 billion kg (dry weight) of organic matter, the minimum amount annually available for fuel and fertilizer (from our previous calculations), is roughly 630 billion kg (wet weight), assuming for simplification that both plant wastes and dung contain 20 percent solids.
Given current practices, this biomass would be mixed with water at a 1:1 ratio if it was to be fed into a biogas system. The total influent would weigh 1.2 trillion kg. Twenty percent of this would be lost during microbial digestion. Of the remainder, the percentage of total solids per kg of weight of slurry would be about 6.4 percent. The digested biomass thus would contain 61 MT of solids.
Table I-2 shows the relative fertilizer content of biogas slurry and farmyard manure.(14) Based on this table, 61 MT of the total solids in biogas slurry would yield approximately 1.037 MT of nitrogen (N), .976 MT of phosphorus pentoxide ([P.sub.2][O.sub.5]), and .610 MT of potassium monoxide ([K.sub.2.O]) per annum.
Without a more detailed picture of the current end uses of organic residues, it is difficult to assess accurately the potential impact of a large-scale biogas program on overall fertilizer supply. Importation of chemical fertilizer is a function of the gap between demand and domestic production. Domestic production is comprised of indigenous production of chemical fertilizers and the use of organic residues and wastes that are composted as farmyard manure. Any net increase in the
Table I-2 Average Fertilizer Value of Biogas Slurry and Farmyard Manure
(Percentage of dry weight)
Substance N [P.sub.2][.O.sub.5] [K.sub.2.O] Total
Biogas slurry 1.7 1.6 1.0 4.25
Farmyard manure + compost 1.0 0.6 1.2 2.8
amount of fertilizer derived from organic residues can be used to offset imports, assuming of course that domestic production of chemical fertilizers remains constant. The net increase in available fertilizer attributable to biogas slurry is derived from the following calculations:(15)
a) [F.sub.n] = [F.sub.ba] + ([F.sub.fyma] - [F.sub.fym])
where:
[F.sub.n] = the net increase in fertilizer
[F.sub.ba] = fertilizer value of currently burnt biomass, if it was digested anaerobically instead.
[F.sub.fyma] = fertilizer value of biomass currently composted as farmyard manure, if it was digested anaerobically.
[F.sub.fym] = fertlizer value of biomass currently composted as farmyard manure.
b) Surveys from 13 states during 1962-69 found that 72 percent of total dung is collected on an average from urban and rural areas. When this figure is combined with earlier calculations, we find that 92.1 MT of rural dung (dry weight) X 72 percent = 66.3 MT of dung (dry weight) that is actually used as manure in rural areas each year. An estimated 10 MT (dry weight) of a possible 34 MT of agricultural residues are added to this. This produces a total of 76.3 MT of dung and agricultural residues that currently are being used for fertilizer in rural areas. The remaining 25.8 MT of dung and 24 MT of agricultural residues, or a total of 49.8 MT (dry weight), currently are consumed as fuel, assuming the same rate of collection and distribution as explained above.
c) Using the calculations from (b) above and Table II, the values for [F.sub.ba], [F.sub.fyma], and [F.sub.fym] are shown below. Values are in MT:
N [P.sub.2][O.sub.5] [K.sub.2.O] _____ _______ _______
[F.sub.ba] .847 .797 .498
[F.sub.fyma] 1.297 1.221 .763
[F.sub.fym] .763 .458 .916
d) Therefore, the net increase in fertilizer due to digesting available organic material in biogas is approximately:
[F.sub.ba] + ([F.sub.fyma] - [F.sub.fym]) = [F.sub.n] (a)
.847 + (1.297 - .763) = 1.381 MT of N.
.797 + (1.221 - .458) = 1.560 MT of [P.sub.2][O.sub.5]
.498 + (0.763 - .916) = .345 MT of [K.sub.2]O
In 1979-1980, 1.295 MT of N, .237 MT of P, and .473 MT of K were imported at a cost of Rs 887.9 crores with additional subsidies of Rs 320 crores.(16) While our calculations show the enormous potential of biogas slurry in meeting domestic fertilizer needs, it must be noted that to organize such an effort would be a massive task. Manure would have to be collected from very diffuse points and transported to farms as needed. Fertilizer requirements will increase dramatically as India's population approaches one billion people shortly after 2000 A.D., including an increased demand for chemical fertilizers. Organic fertilizers from the slurry of biogas systems could certainly contribute to fertilizer supply needs. Our analysis is probably somewhat understated in that, as additional residues will be available from increased crop production, a potential increase in cattle population or improved cattle diet will mean more dung. Also, a variety of organic materials such as water hyacinth, forest litter, and other under-utilized biomass could all be digested, increasing the fertilizer derived from biogas slurry.
The above discussion is intended only to illustrate the order of magnitude of the potential impact of large-scale utilization of biogas systems. Much of the data used were aggregated from small and often inaccurate sample surveys, causing considerable margins of error. This problem will be discussed further at the end of this section.
Additional insight into the potential contribution of biogas systems can be obtained from recent projections of rural energy demand. Commercial and noncommercial energy demand, based on the Report of the Working Group on Energy Policy, is shown in Table I-3.
This data is the basis of the Reference Level Forecast of the study, an extrapolation of current trends. It is interesting to note that the household sector (90 percent of India's households are in rural areas) is assumed to account for almost all noncommercial fuel consumption throughout this period, except for 50 MTCR of firewood, agricultural residues, and bagasse that are used in industry. The Working Group also suggests that noncommercial fuels, as a percentage of total household demand, will gradually decline from the current 83.9 percent to 49.7 percent, and that the percentage of the total noncommercial fuel demand in all of India will drop from 43.5 percent to 11.5 percent.
Table I-3 Reference Level Forecast Energy Demand (1976 - 2000) In Household and All-India In Millions of Tonnes of Coal Replacement (MTCR)(17)
Commercial Fuels MTCR (percent of total)
1976 1983 2000 _____________ ______________ ______________
Household 37.4 (16.1) 51.6 (20.2) 165.5 (50.3) All-India 252.7 (56.5) 390.2 (65.7) 1,261.3 (88.5)
Non-Commercial Fuels MTCR (percent of total)
1976 1983 2000 _____________ ______________ ______________
Household 194.6 (83.9) 204.1 (79.8) 163.5 (49.7) All-India 194.6 (43.5) 204.1 (34.3) 163.5 (11.5)
Note: Indian coal contains 5,000 kcal/kg.
The Working Group does not view this situation as desirable, and offers an Optimal Level Forecast based on a series of policy recommendations. This is shown in Table I-4.
For this optimistic projection to be realized (assuming total demand remains the same), commercial fuels will need to be substituted increasingly by noncommercial fuels. By 1983, noncommercial demand for all-India must increase by 1.3 MTCR over present projections.
Table I-4 Optimal Level Forecast(*) Energy Demand (1982 - 2000) For Household Sector and All-India In Millions of Tonnes of Coal Replacement (MTCR)(18)
Commercial Fuels MTCR (percent of total)
1983 2000 _____________ ______________
Households 51.6 (20.0)() 134.3 (41.0)() All-India 388.9 (65.4) 1,017.8 (71.3)
Non-Commercial Fuels MTCR (percent of total)
1983 2000 _____________ ______________
Households 204.1 (80.0) 194.7 (59.0) All-India 205.4 (34.6)(*) 407.0 (28.7)(*)
(*) Note: The author has calculated commercial fuel demand for households and non-commercial fuel demand for All-India on the assumption that the Reference Level Forecast total demand for each category remains constant. A relative increase in demand for commercial fuels would cause a relative decrease in demand for non-commercial fuels. Conservation measures would reduce overall demand, and thus reduce the amount of non-commercial fuels needed to bridge the gap between supply and demand.
The actual figures are not included in the Report of the Working Group on Energy Policy.
By the year 2000, the household noncommercial fuel demand must increase by 31.2 MTCR, and noncommercial fuel demand in all of India must increase by 273.5 MTCR if commercial fuel consumption is to remain at the level suggested in the Optimal Forecast (without additional conservation).
Though these projections can be criticized for relying on suspect sample data(19) or questionable assumptions,(20) The Report of the Working Group nonetheless shows clearly that an increase in energy from noncommercial, renewable resources is a high priority. The report specifically describes biogas systems as "the most promising alternative energy technology in the household sector," although it does not minimize some of the problems associated with the technology.(21)
The optimal level forecast for irrigation and lighting (based on a series of recommended conservation measures) is shown in Table I-5.
Table I-5 Electricity and Diesel Demand: Irrigation and Rural Lighting (1976 - 2000)(22)
Increase 1978 1983 2000 1978-2000 IRRIGATION
Diesel 2.6 4.6 6.6 + 4.0 (billion liters)
Electricity 14.2 16.0 28.0 +13.8 (billions of KWH)
HOUSEHOLD ELECTRICITY 4.4 10.7 32.2 +21.5 (billions of KWH)
(With rural (3.7) (9.6) (29.0) (+25.3) households at 90 percent of total)
Total Rural 17.9 25.6 57.0 +39.1 Electric Demand (billions of KWH)
NOTE: Electric pumps consume approximately 3,000 KWH/year/ pumpset (at about 5 HP/pumpset).
Diesel pumps consume approximately 1,000 liters (.8 tonnes) of diesel fuel/year/pumpset.
In 1978-1979, an estimated 360,000 electric pumpsets and 2.7 million diesel pumps were used for irrigation. Future growth is projected to increase to 5.4 million electric pumpsets and 3.3 million diesel pumps by 1983. The estimated ultimate potential of 15.4 million energized wells optimistically is reached by the year 2000, when there will be 11 million electric pumpsets and 4.4 million diesel pumps in operation. Animal-power lifting devices are expected to decline from around 3.7 million in 1978 to 660,000 by the year 2000.(23)
As shown in Table I-5, the total increase in projected diesel fuel demand for irrigation between 1978-2000 is 4 billion liters or 16 billion BHP-hrs, since .25 liters of diesel generate 1 BHP-hr. For the same period, rural electricity demand (irrigation and household lighting) is expected to increase by 39.1 billion kwh. Modified diesel engines can run on a mixture of 80 percent biogas and 20 percent diesel. Since .25 liters of diesel = 1 BHP, .05 liters can be mixed with .42 [m.sub.3] of biogas to generate the same power. Using a conversion factor of 1 BHP = .74 kwh, .07 liters of diesel mixed with .56 [m.sub.3] of biogas will generate 1 kwh.(24) Therefore, the 16 billion BHP-hrs required by the year 2000 to run diesel pumpsets could be supplied by a little over 6.7 billion [m.sub.3] of biogas and .8 billion liters of diesel fuel. Alternatively, the 39.1 billion kwh required for rural electricity needs could be supplied by 21.9 billion [m.sup.3] of biogas and 2.74 billion liters of diesel fuel.
We have previously calculated that at least 25 billion [m.sub.3] of biogas is potentially available from current patterns of biomass use. If, and it is a big "if", an alternative cooking fuel could be supplied to those areas that presently rely on dung and plant wastes, perhaps with fuelwood plantations, this biomass could be shifted toward meeting a large share of increased demand for commercial fuels in rural areas. Since food production and cattle population will have to increase to keep pace with population growth, the amount of available biomass, and hence biogas, will expand similarly. The total increase in rural commercial fuel demand could be met by a mix of 28.6 billion [m.sub.3] of biogas and 3.6 billion liters of diesel, which is less than the 4 billion liters projected in Table I-5. Such a substitution seems well within the range of technical possibilities.
Some of the economic aspects of substituting biogas for diesel and electricity are discussed in section VI. In many villages, the costs of connection to the nearest central grid are prohibitive even if the load were increased to include lighting, pumpsets, etc.(25) For some areas, biogas may represent the only viable technology, whether or not the gas is burned directly or converted to electricity. As the Working Group notes, despite the fact that roughly half of India's villages are electrified, population increases have kept the percentage of total households that are electrified relatively constant at 14 percent. Within "electrified" villages, only 10-14 percent of the houses obtain electricity for household applications. Only 5 percent of rural houses use electricity for lighting because rural family incomes cannot support the high installation cost of electricity.(26)
As an alternative, a benefit of a large-scale biogas program could be to free up the millions of tonnes of firewood that are consumed annually for cooking. Using the Working Group on Energy's norm of 1 MT of firewood (all types) = .95 MTCR, this represents almost 66.8 MTCR, which is over 30 percent of the increased demand for noncommercial fuels, or 10 percent of the increased demand for commercial fuels in the optimal level forecast for the year 2000. While the actual use of this vast amount of energy would depend on the economic, social, and managerial constraints associated with various thermal conversion processes, the possibilities for converting this energy into electricity, gas, or pyrolytic oil deserve serious consideration.
Before biogas could be used as a substitute for commercial fuels, a number of complex energy demand, investment, and development issues would need to be analyzed carefully. Such an analysis is far beyond the scope of this study. Nevertheless, it is in India's interest to raise these questions since there are many different energy supply mixes that are technically possible, given India's resources. The preceeding discussion is intended only to show the magnitude of the potential contribution that biogas systems could make to India's energy and fertilizer needs.
A number of technical, political, and organizational problems must be solved before a large-scale biogas program can be undertaken. The remainder of this study is devoted to exploring these problems in some detail. II. An Overview of Biogas Systems
Most biogas systems consist of a basic series of operations, which is described briefly in this chapter. There may be certain variations or additions to this basic schematic design, especially if the system is integrated with other "biotechnologies," such as algae ponds or pisciculture, or if additional uses can be found for carbon dioxide ([CO.sub.2]) that is present in biogas. A brief description of the different aspects of a biogas system is necessary before discussing the economic and social dimensions of the technology.
RAW MATERIAL (BIOMASS) COLLECTION
Almost any organic, predominantly cellulosic material can be used as a feed material for a biogas system. In India, the Hindi name for these systems, "gobar" (dung) gas plants, is imprecise. This is shown by the following list of common organic materials that may be used in gobar gas plants:(27)
* algae * animal wastes * crop residues * forest litter * garbage and kitchen wastes * grass * human wastes * paper wastes * seaweed * spent waste from sugar cane refinery * straw * water hyacinth and other aquatic weeds
Table II-1 on the following page shows some laboratory yields associated with different biomass. It is important to remember that the amount of gas produced from different kinds of biomass depends on a number of variables. The most important of these include the temperature and the amount of time that the biomass is retained in the digester, which is called the loading rate. Unless stated otherwise, all biomass has been tested at 35 [degrees] C and retained for a 35-day period.
Despite the obvious sanitation benefits of feeding human feces into a biogas digester, this practice produces a per capita daily gas yield of only about .025 [m.sup.3]. This means that the excrement from perhaps 60 people would be needed to provide enough gas for the cooking needs of a family of five people. In addition, excessive slurry dilution can result from uncontrolled
Table II-1 Gas Yields for Selected Organic Materials(28)
Material Gas yield in [m.sup.3]/kg of volatile solids, cattle dung .20 human feces, .45 banana stems, .75 water hyacinth, .79 eucalyptus leaves .89 rinsing in a community latrine, since all the latrine water will enter the digester. Corrosive hydrogen sulfide ([H.sub.2]S) is more prevalent in human waste than in animal dung. This may adversely affect engines run on the biogas unless the gas is passed through iron filings for purification. Nevertheless, the role of human enteric pathogens in the communication of disease is well established. Therefore, latrines could be incorporated into a biogas system, provided they are accepted by villagers, affordable, not disruptive of the digestion process, and not harmful to any engine operation. Safe procedures for handling both influent and effluent also must be developed. More research is needed to understand the effects of different combinations of temperatures and retention times in killing harmful pathogens that could remain in the digested slurry.
Water hyacinth is particularly appealing because it is not used as animal fodder, and therefore does not present any "food or fuel" choices. In addition to its higher gas yield, water hyacinth produces gas that appears to have a greater methane content and more soil nutrients than digested dung. However, there are some drawbacks to using water hyacinth. One is that its water requirements are vast. Through transpiration from its leaves, hyacinth absorbs from three to seven times the amount of water that would normally be lost to surface evaporation from the water occupied by the hyacinth. Water hyacinth also can become a breeding ground for mosquitoes and snails, although these can be controlled by introducing predator fish.(29)
There are certain annoyances associated with the use of this and other plant materials. Younger plants yield more gas than older plants, which may necessitate greater discrimination in the manner in which biomass is collected. Plants may have to be dried and shredded to ensure proper mixing, dilution, and digestion. It may often be necessary to add urine to maintain a proper carbon to nitrogen (C/N) ratio. There have been many field reports of scum build-up, clogged inlet tanks, and toxicity to methanogenic bacteria (due to the "shock" caused by the introduction of different biomass materials). However, these reports are sketchy, and the problems could be due to improper digester design or operation. Water hyacinth is almost always mixed with dung; there is little reliable field experience using water hyacinth as the sole input, although this has been done successfully in laboratories, as will be discussed shortly.
Several Indian research groups have been experimenting with "bio-dung"--a fuel cake and/or biogas feed material made from dried and partially composted organic matter of varying combinations.(30) Excellent gas yields have been reported with this still experimental idea, but documentation is insufficient. Nonetheless, this practice of "partial digestion" of the biomass in plastic bags seems similar to the 10-day "predigestion" period observed in China, where organic material is composted prior to batch loading in family digesters.(31) The Chinese report faster gas production if material is partially digested. The process probably reduces the [CO.sub.2] present in the early phases of digestion by simply releasing it in the atmosphere as the gas percolates up through the compost pits.
There are many advantages claimed by proponents of "bio-dung," such as its greater gas yield, higher calorific value, potential for generating revenue as a saleable product, eradication of harmful weeds, and making family-scale digesters affordable to those who own fewer than three to four cattle. There is little evidence currently available to evaluate these possibilities.
MIXING AND FEEDING RAW MATERIAL INTO THE DIGESTER
There has been a good deal of experimentation with the digestion of organic materials in various combinations. Regardless of the biomass used, it must be loaded without being diluted excessively with water. Most researchers mix fresh dung and/or sun-dried organic matter with water at roughly a 1:1 ratio. If the plant matter is still green or the cattle diet is rich in straw, the ratio should be changed slightly to about 1:0.8. Materials should have a C/N ratio of roughly 30:1 due to the digestive requirements of methanogenic bacteria. The relative proportions of different material should be adjusted to maintain this ratio.(32)
The inlet tank can become clogged when assorted feeds of different sizes and composition materials are mixed. Fibrous material can be shredded to avoid this. Different digester designs, incorporating larger inlets, may alleviate this problem Most Indian systems work best if the biomass and water are mixed thoroughly in the inlet tank prior to injection into the digester. Many of these inlet tanks have a removable plug to block the inlet pipe during mixing. Alternatively, the Chinese seem to use less water and spend less time mixing material. This is perhaps due to their batch feeding process, which eliminates the need to add slurry daily.(33)
DIGESTION (34)
Anaerobic digestion consists broadly of three phases:
1. Enzymatic hydrolysis--where the fats, starches, and proteins contained in cellulosic biomass are broken down into simple compounds.
2. Acid formation--where acid-forming bacteria break down simple compounds into acetic acids and volatile solids.
3. Methane formation--where methanogenic bacteria digest these acids and solids and give off [CH.sub.4], [CO.sub.2], and traces of [H.sub.2]S.
Any remaining indigestible matter is found in either the "supernatant" (the spent liquids from the original slurry) or the "sludge" (the heavier spent solids). These two products are often described as "slurry" because the influent in most Indian plants is diluted with water at about a 1:1 ratio to form a relatively homogenous, liquid-like mixture. In China, the supernatant and sludge generally settle into separate layers in either the digester itself or in the output tank, and are removed separately by buckets that are lowered to different depths.
During the first phase of digestion, a great deal Of [CO.sub.2] is produced and pH drops off to roughly 6.2 (pH values of less than 6.2 are toxic to the bacteria needed for digestion). After about ten days, pH begins to rise, stabilizing at between 7-8. Temperatures below 15 [degrees] C (60 [degrees] F) significantly reduce gas production. During the winter months, many family-scale biogas systems in northern India reportedly produce only 20-40 percent of their summer yields. Similarly, Chinese plants often produce almost no gas during winter, and more than half the annual energy required for cooking must be provided by burning crop residues directly. However, the need for a backup source of energy to supplement a biogas system can probably be eliminated with some of the design modifications suggested in the next section. Higher temperatures generally increase gas production, reduce retention time, and increase loading rates, once the bacteria adjust to the warmer environment. Mesophilic bacteria favor temperatures near 35 [degrees] C (95 [degrees] F). Thermophilic bacterial strains are found in the 50-60 [degrees] C (122-140 [degrees] F) range. The addition of nitrogen-rich urine seems to aid in gas production during winter, especially when it is combined with plant wastes. Digesting the wet straw flooring from cattle sheds, if available, is a convenient way to add urine to the influent.
The microbial population of methanogenic bacteria will decrease as slurry flows out from the digester. These bacteria have a doubling rate of roughly 40 hours. However, this slow growth rate can be overcome by greatly increasing the microbial population. There has been informal discussion among experts about a process, reportedly developed in Belgium, that uses a membrane to retain the methanogenic bacteria inside the digester. Gas yield per kg of biomass reportedly increases by a factor of 5-10 when the membrane is used. If these claims can be documented, and if the membrane is both affordable and durable, it would be an important development. There also is sketchy evidence that methanogenic bacteria are pressure sensitive. This might be a problem in some fixed dome systems, which can generate pressure above a water column of 80-90 cm. More research is needed on this point.
The effect of animal diet on gas yield has received far less attention than it deserves. Cattle can be either well fed or near starvation, depending on the income of a farmer and the time of year. Farmers often barely maintain their cattle until just prior to plowing season, when the diet is increased to fatten the cattle for work. Obviously, the less an animal eats, the less dung it produces. The more cellulose, especially in fibrous materials, that it eats, the greater the gas yield will be. More research is needed to determine the optimal diet for cattle given their use as a source of milk, motive power, and combustible energy (biogas), and also considering local resources, available capital, and knowledge constraints.(35) Even without this research, however, it is clear that diet, grazing habits, and costs of collection will greatly affect the net available dung yield per animal.
Many statistics quoted in the literature simply may not apply to a particular locale. These include data on dung yield of animals, gas yield of dung, temperature, the nature and nutrient content of other materials digested, and the [CH.sub.4] content, which can vary 50-70 percent for a given quantity of biogas, depending on diet. Inaccuracies usually manifest themselves in an overestimation of gas availability and overall benefits. Norms mentioned in numerous studies are useful guides to these questions but cannot replace micro-analysis.
A great deal of research is furthering our understanding of the microbiological aspects of biogas systems.(36) If gas yield could be increased and retention time reduced, production costs would decrease, since a smaller volume of biomass per cubic meter of gas would be required. Some of the areas or research include ways to increase the growth rate of methanogenic bacteria, improve the digestibility of lignin, develop microbiological. innoculins that would increase gas production, develop bacterial strains that are less sensitive to cold weather, identify micro-organisms involved in digestion, and separate acid-forming and methanogenic bacteria. As of the writing of this study, there have been no major documented performance breakthroughs achieved as a result of this research.
III. Digester Designs
There are many ways to design biogas systems. The designs discussed in this study are by no means the only possibilities. They either have been tested extensively or were in the midst of serious research and development during the writing of this study. Groups attempting to develop their own systems should use the illustrations in this section only as guides. The characteristics and costs of labor, construction materials, land, etc., will vary according to local conditions and the end uses of the system's gas and slurry.
The Khadi and Village Industries Commission (KVIC) design has been developed over the past 15 years and is similar to the
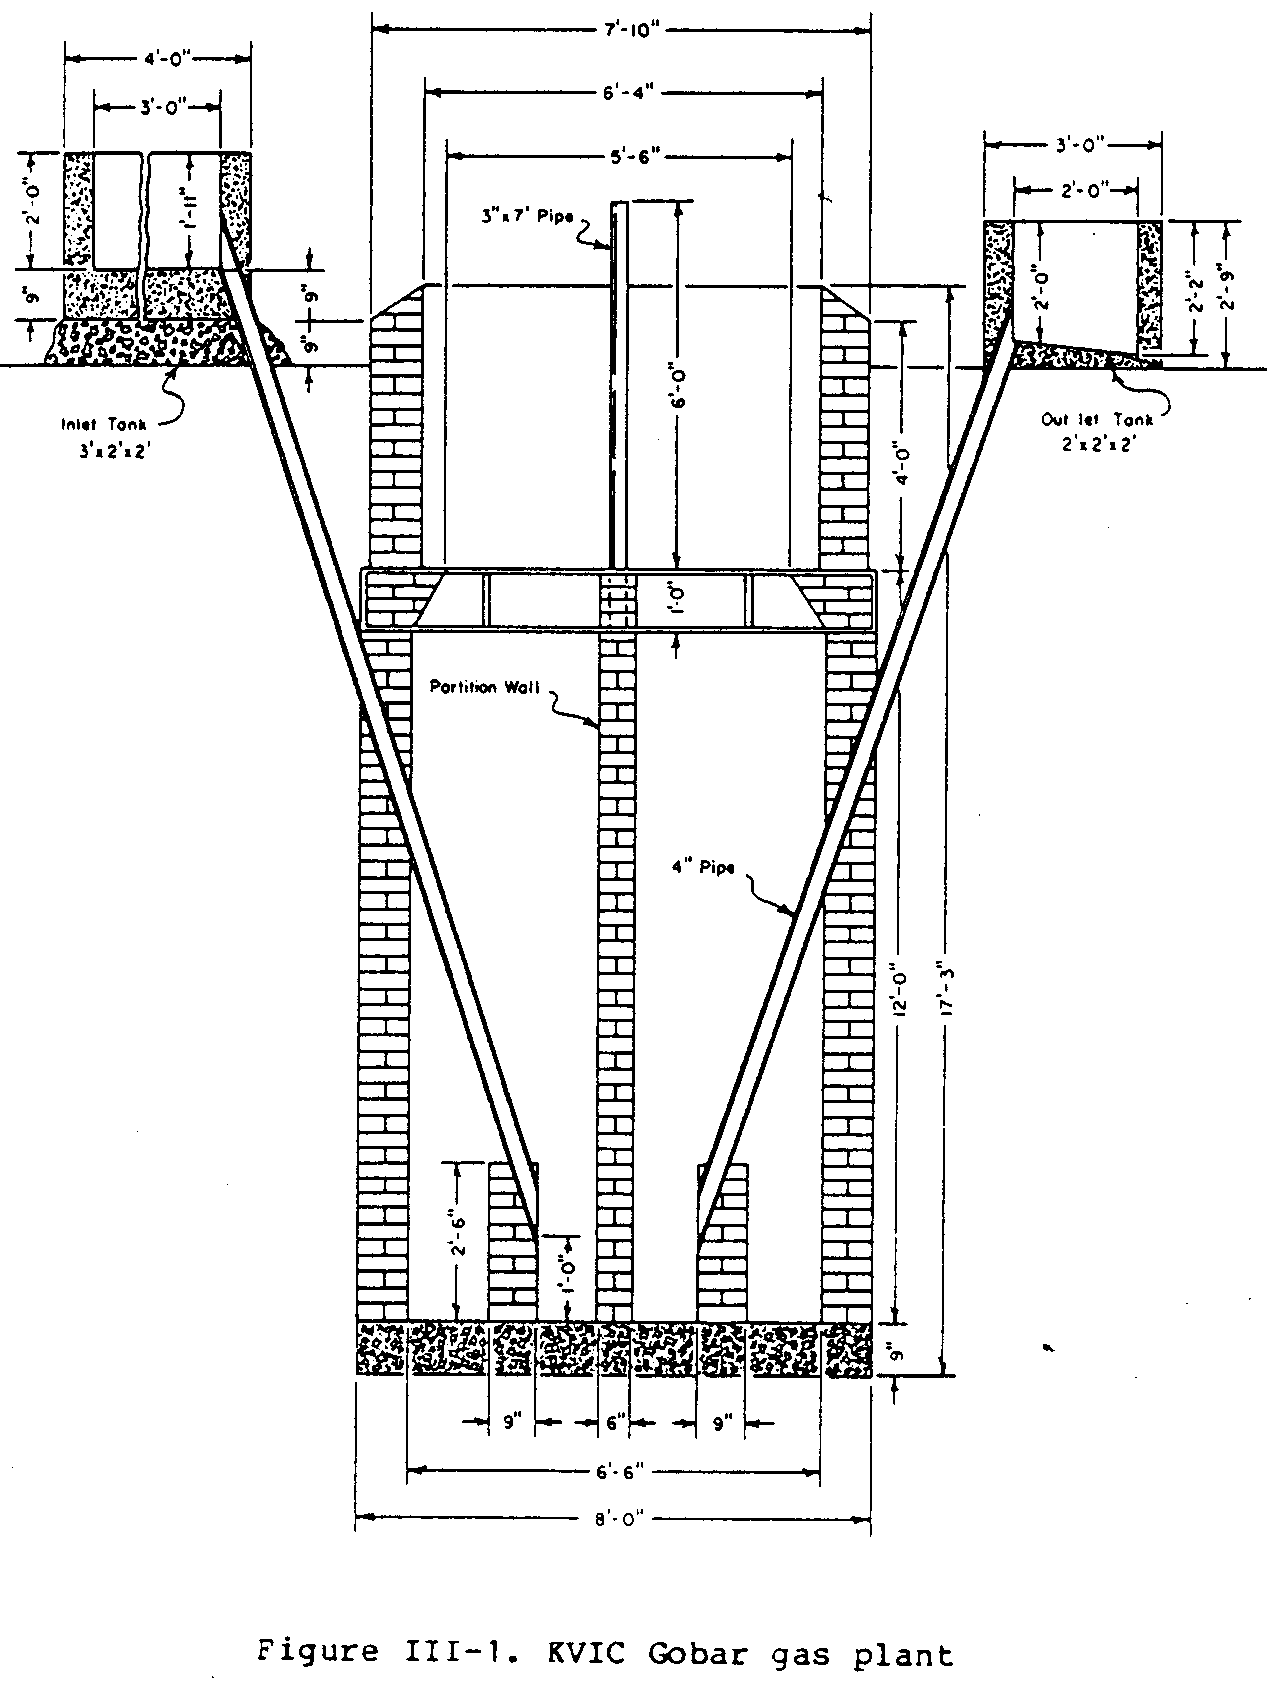
majority of systems currently operating in India (see Figure III-1).(37) As of 1981, KVIC claims to have built about 80,000 of these systems, although there are no reliable data on how many of the units are actually operating, temporarily shut down, or nonfunctioning. The KVIC system consists of a deep well and a floating drum that usually is made of mild steel. The system collects the gas and keeps it at a relatively constant pressure. As more gas is produced, the drum gas holder rises. As the gas is consumed, the drum falls. Actual dimensions and weight of the drum are functions of energy requirements. A long distribution pipeline that might necessitate greater pressure to push gas through its length would require a heavier drum, perhaps weighted with concrete or rocks. Biomass slurry moves through the digester because the greater height of the inlet tank creates more hydrostatic pressure than the lower height of the outlet tank. A partition wall in the tank prevents fresh material from "short circuiting" the digestion process by displacement as it is poured into the inlet tank. Only material that has been thoroughly digested can flow up and over the partition wall into the outlet tank.
Most KVIC systems are designed to retain each daily charge for 50 days, although this has been reduced to 35 days in newer units. The slurry should be agitated slightly to prevent any chance of stratification. This is accomplished by daily rotation of the drum about its guide post for about 10 minutes. In Nepal, some gas holders have been painted to look like prayer wheels. They are turned during frequent religious ceremonies, or "puja" (individual prayer). The Nepali group, Development and Consulting Services (DCS), Butwal, also has modified the KVIC gas pipe connection. It has attached an underground fixed pipe to the guidepost, feeding gas through the guidepipe rather than connnecting a flexible hose to the roof of the gas holder.
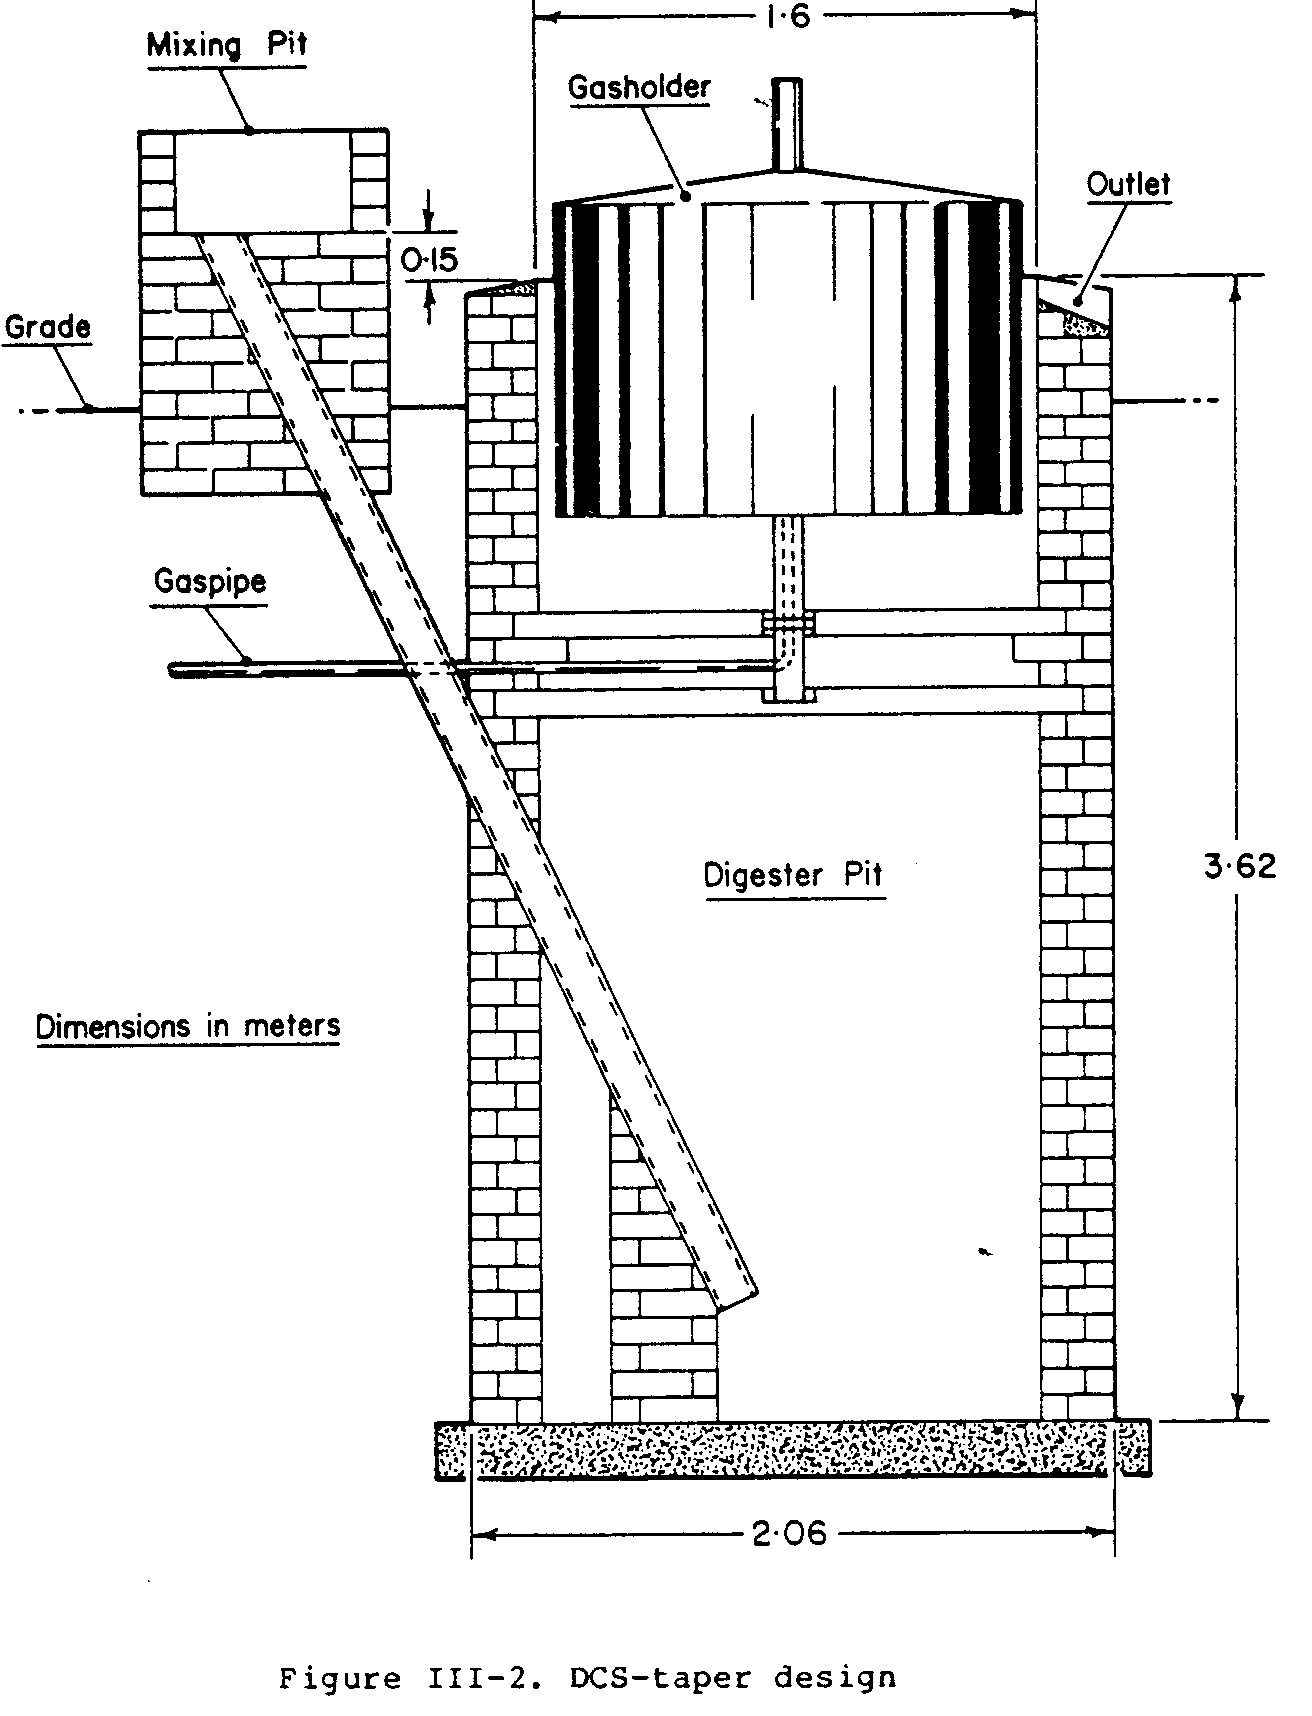
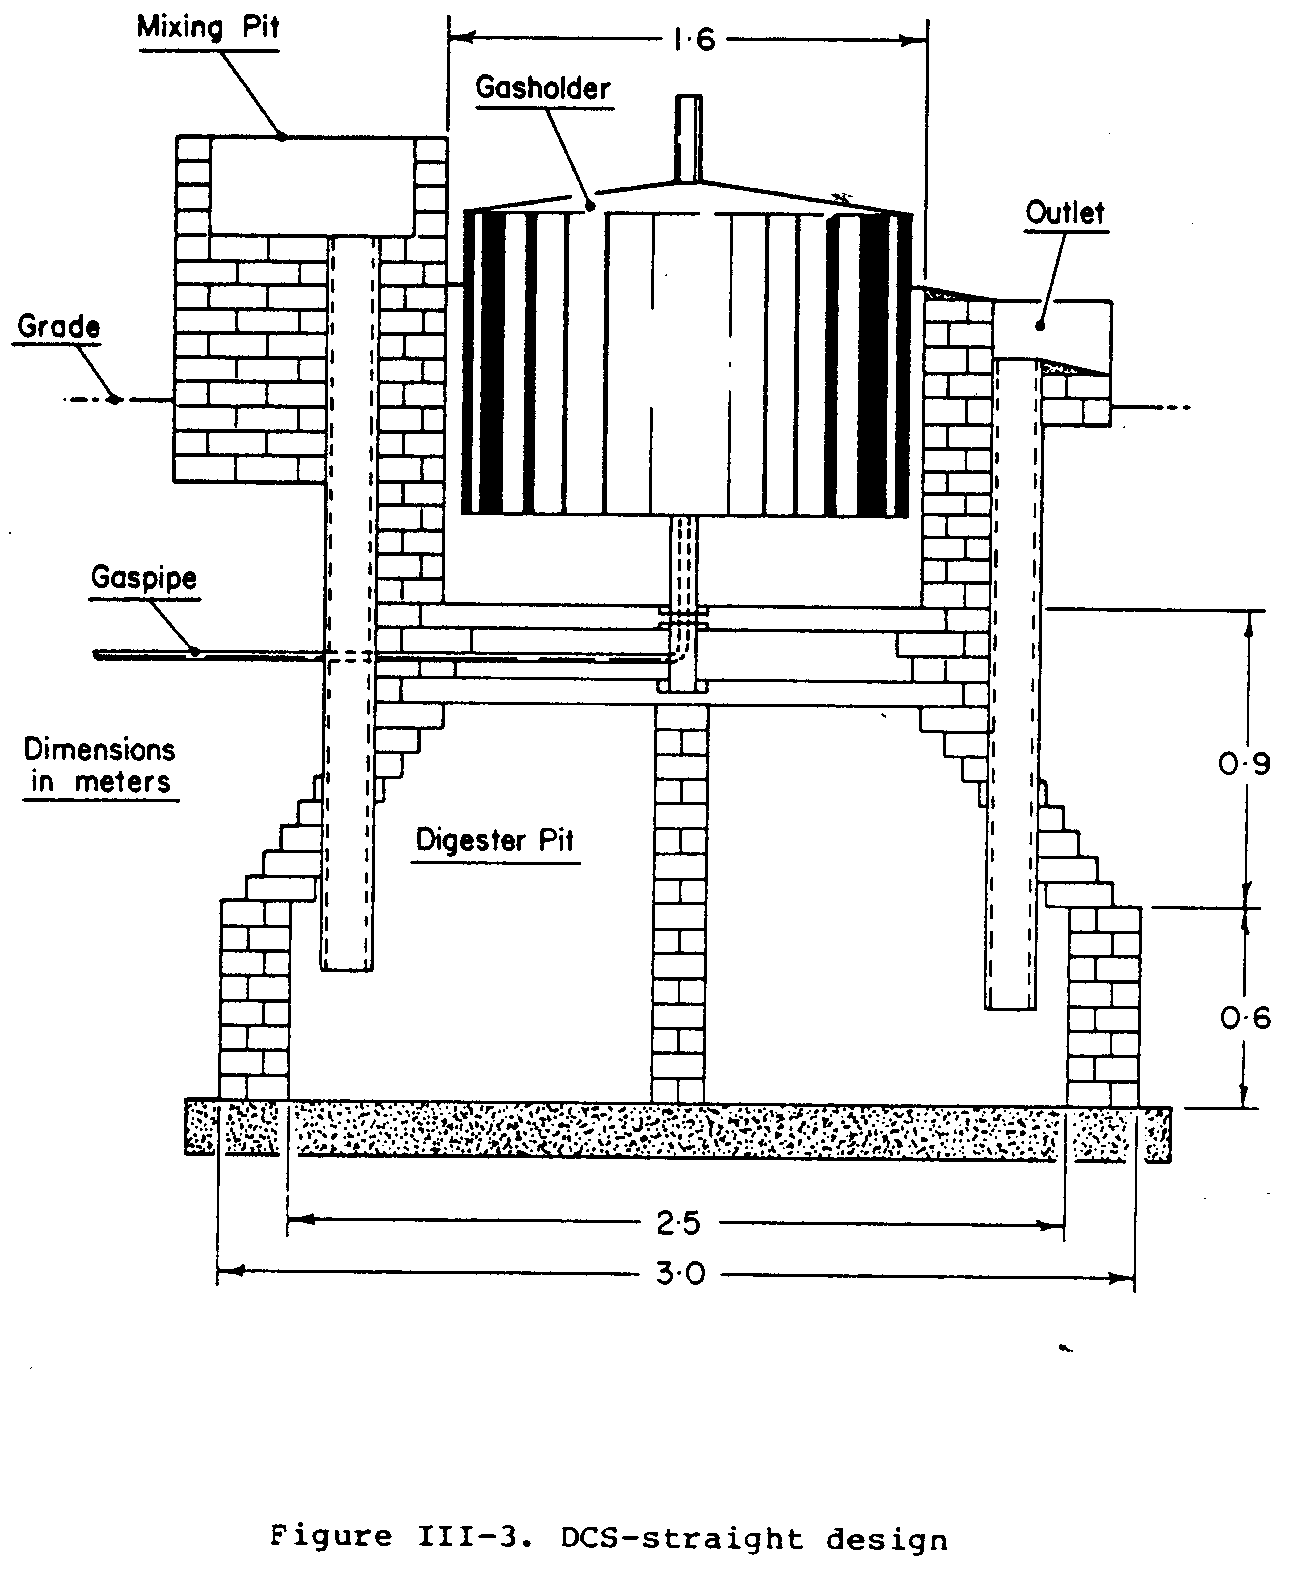
DCS uses a taper design for high water table areas (see Figure III-2) and a straight design for low water table areas (see Figure III-3).
KVIC systems are reliable if properly maintained, although drum corrosion has historically been a major problem. It appears that the quality of steel manufactured in India may have declined during the early 1960s. There are anecdotes of unpainted systems built before then that are still functioning. Drums should be coated once a year with a rustproof bitumin paint. Oil can also be introduced into the top of the digester slurry, effectively coating the steel drum as it rises and falls.
KVIC designs of over 100 [m.sup.3] have been constructed for institutions such as schools, dairies, and prisons. Though construction economies of scale exist for all digesters, the use of mild steel accounts for 40 percent of the system cost. KVIC systems are relatively expensive. The smallest family KVIC system costs well over Rs 4,000 (US$500) to install. KVIC has experimented with a number of materials, including plastics, for dome construction. The Structural Engineering Research Center, Rourkee, has done work with ferrocement, reducing costs somewhat. Ferrocement gas holders become extremely heavy as their scale increases, and they require proper curing and a fair amount of manufacturing skill. The curing process requires that domes be either submerged in water for 14 days or else wrapped in water-soaked cloth or jute sacks for 28 days. This raises questions about their use, or at least their fabrication, in many villages. KVIC would like to prefabricate both gas holders and digester sections at regional centers and then transport these out to villages. This would create rural industry and employment, and introduce quality control into the manufacturing process.
Dr. A.K.N. Reddy and his colleagues at the Cell for the Application of Science and Technology to Rural Areas (ASTRA), and the Indian Institute of Science, Bangalore, have modified the KVIC design in several important ways. The result is a shallower, broader digester than the KVIC design. Table III-1 shows some statistical comparisons between the two designs.(38)
ASTRA also examined the retention time for a charge of biomass, given Bangalore climatic conditions, and reduced the 50-day retention period suggested by KVIC to 35 days. It observed that since almost 80 percent of the total amount of gas produced was generated within the shorter time, the increase in digester capacity necessary to more completely digest slurry did not seem justified. Further research on cutting down retention time as a way to reduce system costs may suggest other design modifications. The shorter the retention period, the less digester volume (and hence, lower cost of construction) is required for the storage of the same volume of organic material. As shown in Table III-I, the ASTRA unit, though almost 40 percent cheaper than the KVIC unit, had a 14 percent increase in gas yield. Its improved performance needs to be monitored over time.(39)
Table III-1 Comparison of KVIC and ASTRA designs for similar Biogas Plants(40)
KVIC ASTRA
Rated daily gas output 5.66 5.66 Gas holder diameter (m) 1.83 2.44 Gas holder height (m) 1.22 0.61 Gas holder volume ([m.sup.3]) 3.21 2.85 Digester diameter (m) 1.98 2.59 Digester depth (m) 4.88 2.44 Digester depth-diameter ratio 2.46 0.94 Digester volume ([m.sup.3]) 15.02 12.85 Capital cost of plant (Rs) 8,100.00 4,765.00 Relative costs 100.00 58.80 Daily loading (kg fresh dung) 150.00 150.00 Mean temperature (Celsius) 27.60 27.60 Daily gas yield ([m.sup.3]/day) 4.28 [+ or -] 0.47 4.39[+ or -] 0.60 Actual capacity/rated capacity 75.6% 86.4% Gas yield (cm/g fresh dung) 28.5 [+ or -] 3.2 32.7 [+ or -] 4.0 Improvement in gas yield +14.2%
The ASTRA group conducted a series of tests on existing biogas systems and found that there was uniform slurry temperature and density throughout the digester,(41) and that the heat lost in biogas systems occurs mainly through the gas holder roof. It also found that when the colder-temperature water was mixed with dung to make slurry, the charge shocked the indigenous bacteria and retarded gas production. The result was a 40 percent or more reduction in gas yield.(42)
An important goal thus was to control the temperature of the slurry. This raised a number of problems: maintaining the slurry temperature at the 35 [degrees] C (95 [degrees] F) optimum; heating the daily charge to minimize temperature loss due to colder ambient temperatures; and providing insulation for the floating drum gas holder. ASTRA found an ingenious solution to all these needs. It installed a transparent tent-like solar collector on top of an ASTRA floating drum gas holder (see Figure III-4).(43)
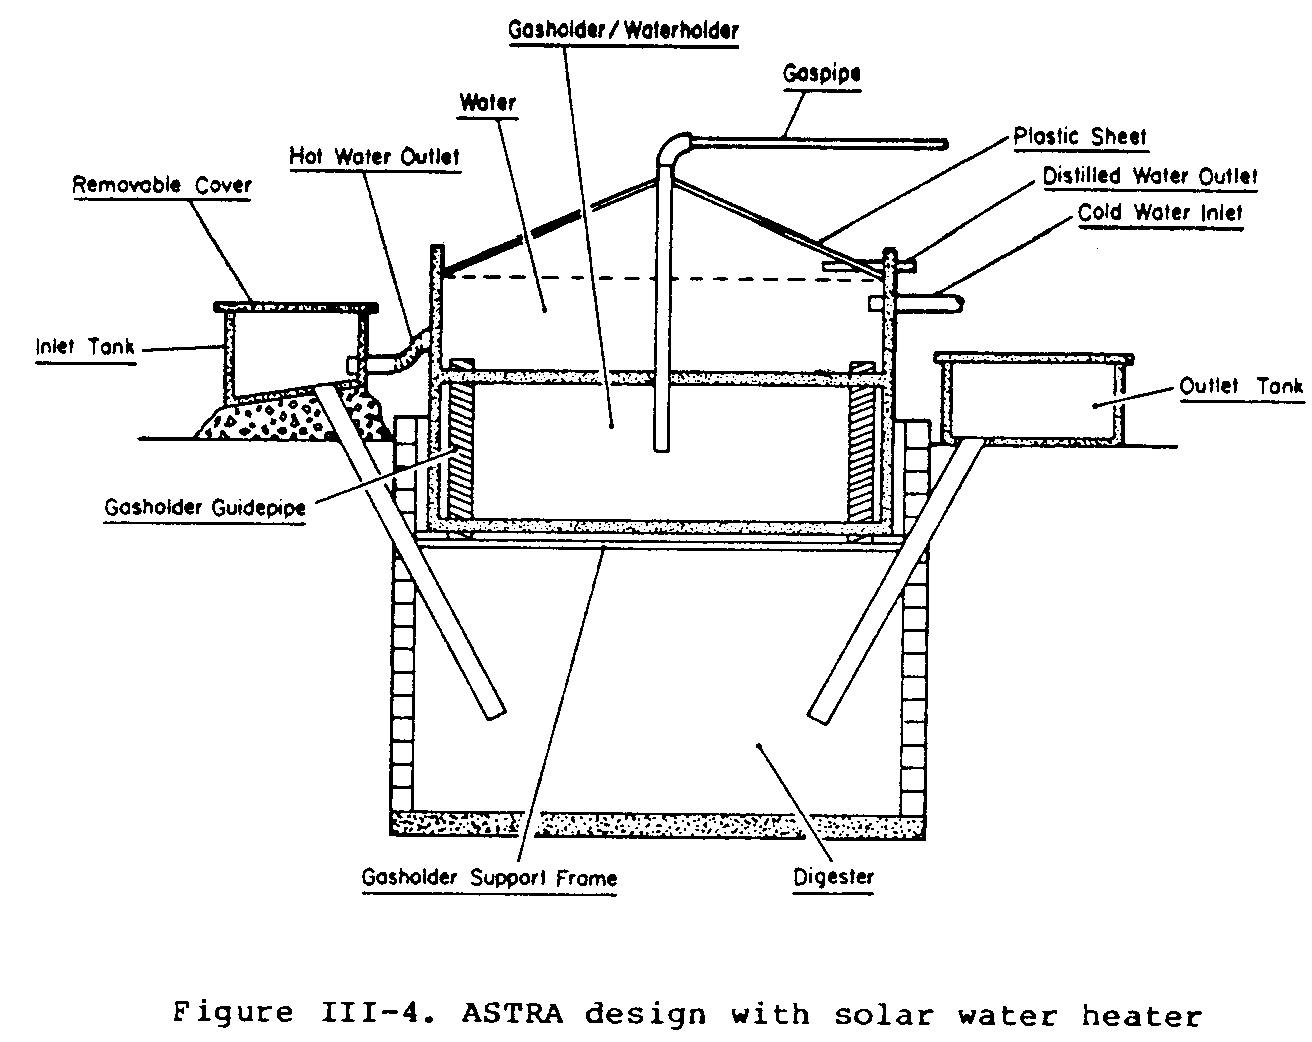
This was done by modifying the drum design so that its side walls extended up beyond the holder roof, forming a container in which to place water. This water was drawn from the collector, heated by the sun, and mixed with the daily charge of dung. Preliminary data from the 1979 Bangalore rainy season showed an increase in gas yield of about 11 percent with this solar heating system. During this often cloudy period, the temperature of the water in the collector was only 45 [degrees] C (112 [degrees] F) compared with the 60 [degrees] C (140 [degrees] F) temperature recorded during the summer months. More work is needed to improve the cost and performance of this solar heating method, but its potential for reducing system costs seems promising, especially on a village scale. In addition, distilled water can be obtained by collecting the condensate as it runs down the inclined collector roof. The ASTRA group is constructing a 42.5 [m.sup.3] biogas system in Pura village, Tumkur District, near Bangalore, that eventually will incorporate ferrocement gas holders and solar heating systems, enabling the group to evaluate its ideas in an actual village context. Dr. C. Gupta, Director of the TATA Energy Research Center, Pondicherry, is constructing an ASTRA design biogas system with a community latrine in Ladakh, Jammu and Kashmir State, where the 3,600-meter altitude and chilly winter temperatures will provide valuable data on the performance of this design. Most recently, ASTRA has reportedly constructed a 2.3 [m.sup.3] fixed dome plant for Rs 900 (US$112). It may be possible to reduce this cost further by experimenting with a compacted earth pit that would be covered by a brick dome. The costs of constructing the brick digester would thereby be eliminated. Such experiments are still quite recent and the data on performance and durability are not yet available. Parts of Karnataka have large, brick-producing activities, and the easy availability of inexpensive bricks may account partially for this low cost. Nevertheless, the potential exists for large reductions in system costs, which could alter dramatically the economics of biogas systems.
The Planning Research and Action Division (PRAD) of the State Planning Institute, Lucknow, has been conducting biogas research at its Gobar Gas Experimental Station, Ajitmal (near Etawah), Uttar Pradesh, for more than 20 years. PRAD constructed the 80 [m.sup.3] community system in the village of Fateh Singh-Ka-Purva, which will be discussed later in this study. After several years of experimentation with designs modified from the fixed dome systems popular in the People's Republic of China, PRAD developed the "Janata" fixed-dome plant.(44)
The PRAD design has several advantages. A Janata plant system can be built for about two-thirds the cost of a KVIC system of similar capacity, depending on local conditions, prices, and the availability of construction materials. The magnitude of savings due to the all-brick Janata design may diminish with increased capacity, but there is little data regarding large fixed-dome plants. One of the key features of the Janata and other fixed-dome designs is that inlet and outlet tank volumes are calculated to ensure minimum and maximum gas pressures due to the volumes displaced by the changing volumes of both gas and slurry inside the system.
Janata designs are relatively easy to construct and maintain because they have no moving parts and because corrosion is not a problem. One drawback is that Janata plants may require periodic cleaning due to scum build-up. As gas pressure increases in a fixed volume, the pressure pushes some of the slurry out of the digester and back into both the inlet and outlet tanks, causing the slurry level in each tank to rise. As gas is consumed, the slurry level in the tanks drops and slurry flows
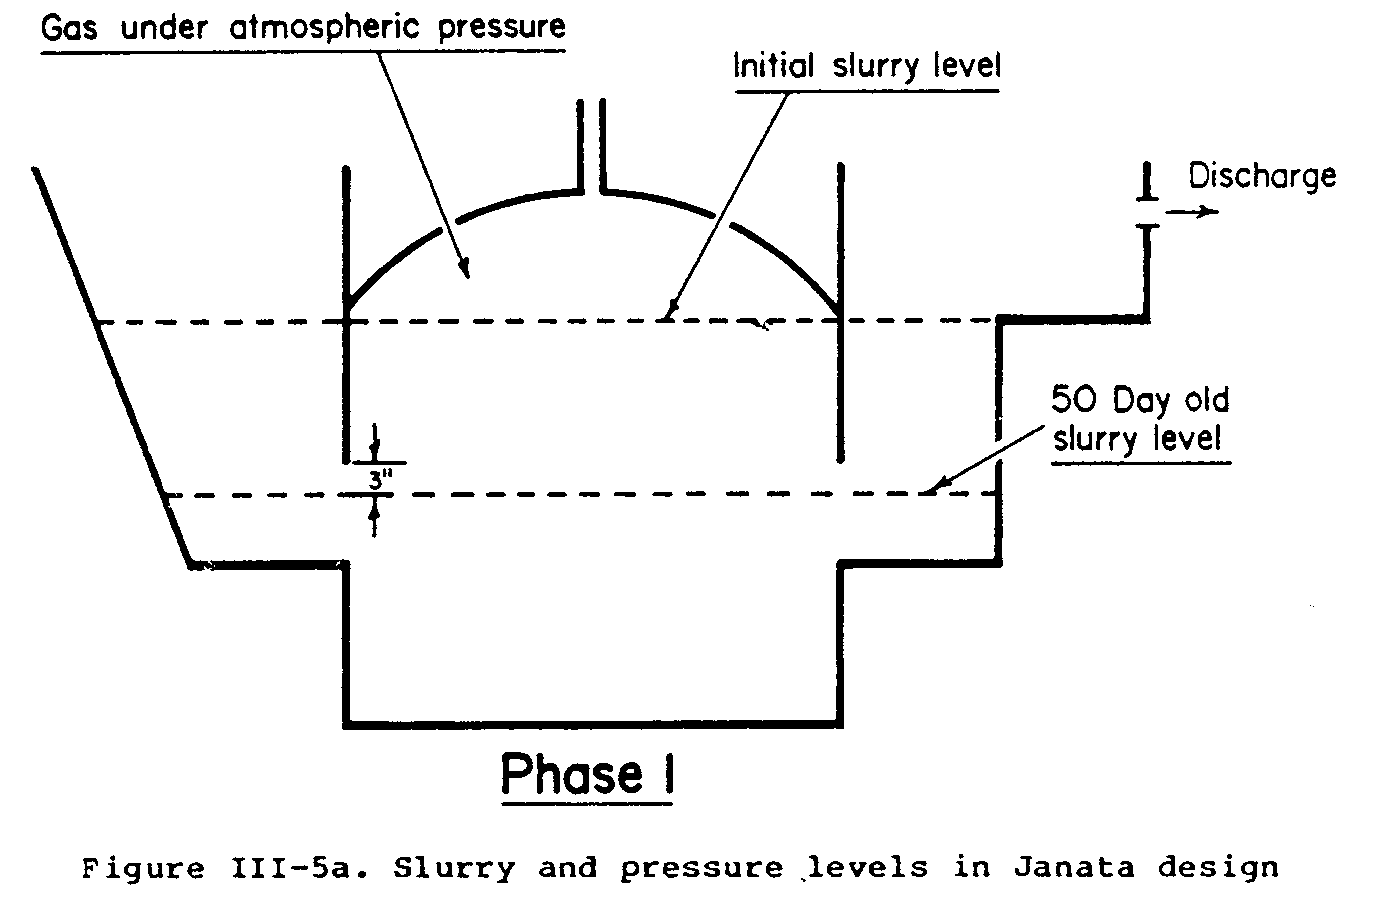
back into the digester itself (See Figures III-5a through III-5d). Such movement probably acts as helpful agitation, but the motion may also cause heavier material to settle on the bottom of the digester. The result then is that only the supernatant flows through the system. Such buildup has been reported occasionally, and may result in a gradual accumulation of sludge that could cause clogging.
The more serious problem is posed by the heterogeneous nature of even the most well-mixed influent. Lighter material can form a layer of scum that remains unbroken precisely because the plants are designed to prevent the slurry level from descending below the top of the inlet and outlet tank openings in the digester, which might allow gas to escape through the tanks. This problem of scum build-up may be more serious in large-scale plants, and may require the installation of stirring devices.
The digester must be cleaned if build-up does occur. Someone must descend into the unit through the outlet tank and scrape out the sludge. The Janata plant has no sealed manhole cover in the dome. This differs from Chinese plants, for which sludge removal is assumed to be a regular part of normal operation. With the Janata plant, extreme caution must be used when entering the digester since concentrated [CH.sub.4] is highly toxic and potentially explosive. The Chinese often test this by lowering a caged bird or small animal into an emptied digester, exposing it to the gases for some time, and then descending only if the animal lives.
More research is needed on the kinetics and fluid dynamics of fixed-dome plants. The ASTRA observation of homogeneous slurry density in the KVIC unit would seem to conflict with some field reports, although poor maintenance and lack of thorough mixing may account for such discrepancies.
An important advantage of Janata plants is that their required construction materials are usually available locally. Lime and mortar can substitute for concrete. Neither steel (which often is scarce) nor ferrocement are needed, which reduces dependence on often unreliable outside manufacturing firms and suppliers. The dome of the Janata plant does require a good deal of skilled masonry, including several layers of plastering, to ensure a leak-proof surface. Many early plants leaked badly. PRAD reports this is no longer a problem due to extensive construction experience and the fact than it has trained many local masons in Uttar Pradesh who can competently construct such units.
Although PRAD recommends constructing a raised platform to support the earthen mound that serves as the form for the construction of the brick dome, the Chinese build brick domes with little or no support scaffolding. It is difficult to learn this technique unless one visits a construction team in China. The few manuals that exist are inadequate in explaining the construction method, often omitting details such as the angle at which bricks should be laid to form the correct arc for the dome, or the number of rings required for bricks of unknown dimensions.
Using some PRAD diagrams and A Chinese Biogas Manual, translated by the Intermediate Technology Development Group (London, 1980), the author directed the construction of a modified 2 [m.sup.3] Janata plant to be used as an experimental digester at the Indian Institute of Technology, Madras. A free-standing dome was successfully constructed, but the process took three days and required vigilant monitoring of cracks that occasionally began to spread around different areas of the brick rings that formed the dome. The safety of masons working under the emerging dome was cause for some concern. The weight of the partially formed arc sections easily could have proven fatal if someone had been caught underneath a collapsing section. It also was difficult to set the bricks at a proper angle. The dome emerged somewhat misshapen, despite the use of a two-pole system in which one pole defined the vertical axis and the other, equal to the radius of a sphere formed by "extending" the dome, pivoted about a nail. By rotating the vertical pole 360 [degrees] and lining up each brick ring with the angle formed by pivoting the "radius" pole between 45 [degrees] and 135 [degrees] (off the horizontal), the correct dome arc, and hence each brick's proper angle, should have been readily apparent. However, due to the irregular surface of the bricks, the varying amounts of concrete applied to the bricks, and the reluctance of the masons, for whatever reason, to use the device frequently, the dome construction became a matter of educated guesswork.
Given the short time many of the Janata systems have been operating, the possibility still exists that micro-cracks may develop in the dome over several years. The Center for Science for Villages, Wardha, has covered the top of its fixed-dome plants with water so that any leaks will be visible as bubbles. This idea could be further modified to incorporate an ASTRA type solar collector to produce warm water for hot charging. However, one of the additional advantages of the fixed-dome designs is that they are largely underground. This frees the surface land area for alternative use. Improved system performance due to solar heating must be evaluated against other possible uses of the land.
Fixed-dome plants release stored gas at pressures as high as 90 cm (36") of water column. As gas is consumed, and in spite of the changing slurry level, pressures do drop. The amount of gas inside the dome at any time can be estimated crudely by measuring changes in the slurry level in the inlet and outlet tank (as long as the daily charge has settled in the digester).
There is some concern that flame temperatures drop with lower pressures, increasing cooking time and gas consumption. However, there seems to be little complaint from individual users on this point. Minimizing gas consumption during cooking can be of great importance in a village system that requires gas for uses other than cooking. There are few data on the economic and thermodynamic efficiencies of diesel or petrol engines or of generators powered by a fixed-dome system. Presumably, more diesel would be consumed as pressure drops. Gas pressure regulators have been discussed periodically as a way to alleviate this problem. Regulators can ensure that enough pressure is maintained throughout a distribution system, and that occasional high pressure will not blow out valves or pipe joints. Work is now under way in Sri Lanka near the University of Peredeniya, in Uttar Pradesh, and in Bihar on fixed-dome plants as large as 50 [m.sup.3]. Plants of this size have been reported in China, but little information is available to confirm this. It remains to be seen if cost reductions observed in small-scale, fixed-dome plants will be repeated or even improved with increased scale. Constructing large domes from bricks, or even from ferrocement, may prove difficult and/or expensive since their performance and durability remain a matter of speculation.
Variations on the fixed-dome design have been reported in Taiwan, where heavy gauge collapsible Hypalon/Neoprene bags have been used as digesters.(45) The Sri A.M.M. Murrugappa Chettiar Research Center (MCRC), Madras, has developed a brick digester with a high-density polyethelene gas holder supported
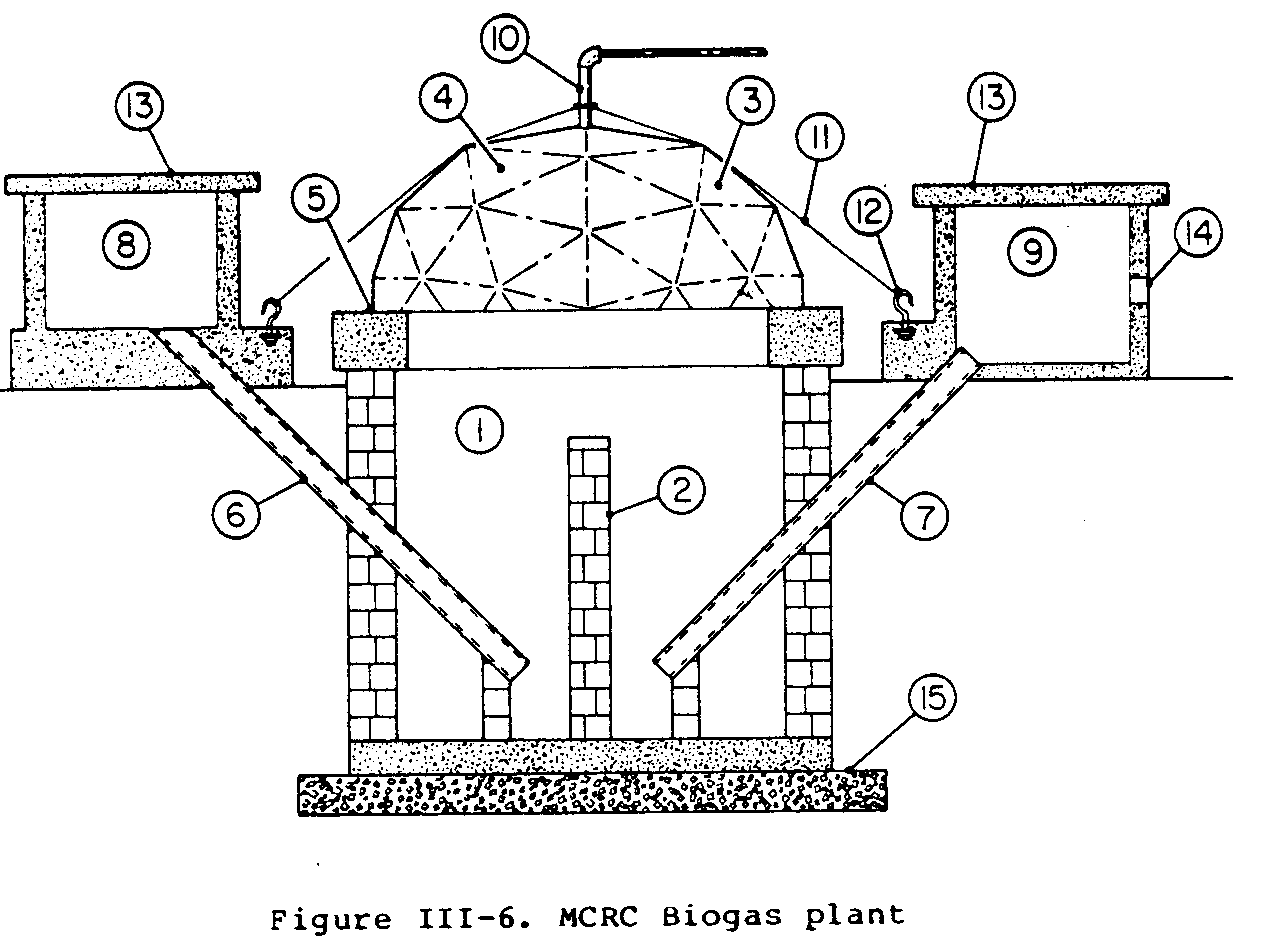
by a geodesic frame (see Figure III-6). The frame is bolted to the digester walls, and the plastic gas holder is retained by a water seal. The MCRC plant is still being tested in several Tamil villages and few performance data are available. The plant is less expensive than the PRAD Janata design and has the advantage of being easily and quickly installed. However, major questions remain concerning this design's durability and safety. Only small-scale systems have been constructed, although larger systems are planned.(46)
Development and Consulting Services (DCS) of the Butwal Technical Institute, Butwal, Nepal, has begun field testing a horizontal plug-flow digester design based on the work of Dr. William Jewell of Cornell University (USA). A long, shallow, horizontal system night require less water, be less susceptible to scum formation and clogging, and foster greater gas production. A plug-flow system should be easier to clean, and would require less excavation, helping to reduce costs. This system has great promise; a prototype should be developed within a year.(47)
The Jyoti Solar Energy Institute, Vallabh Vidynagar, Gujarat (near Anand), has done some interesting design work in conjunction with the research on agricultural residues discussed earlier. JSEI researchers found that a scum layer was forming in experimental digesters that were fed with banana stems, water hyacinth, and eucalyptus leaves. This layer gradually reduced gas production to almost zero. The researchers concluded that the scum layer formed because the fresh biomass contained a good deal of oxygen between its cell walls. Since the shredded sections were lighter than the water they displaced, the biomass tended to float to the surface of the slurry. During experimental batch feeding, this scum layer was observed to sink gradually to the digester floor as digestion progressed. The scum layer that has troubled many of the digesters used for agricultural residues seems to form when fresh biomass, entering at the bottom of the digester, pushes up against heavier, older biomass that is settling toward the digester floor. The lighter biomass causes the heavier layer to rise, creating the thick scum layer. JSEI engineers devised an ingenious system of loading fresh biomass through the top of the gas holder to the surface of the slurry by means of a plunger arrangement (see Figure III-7).
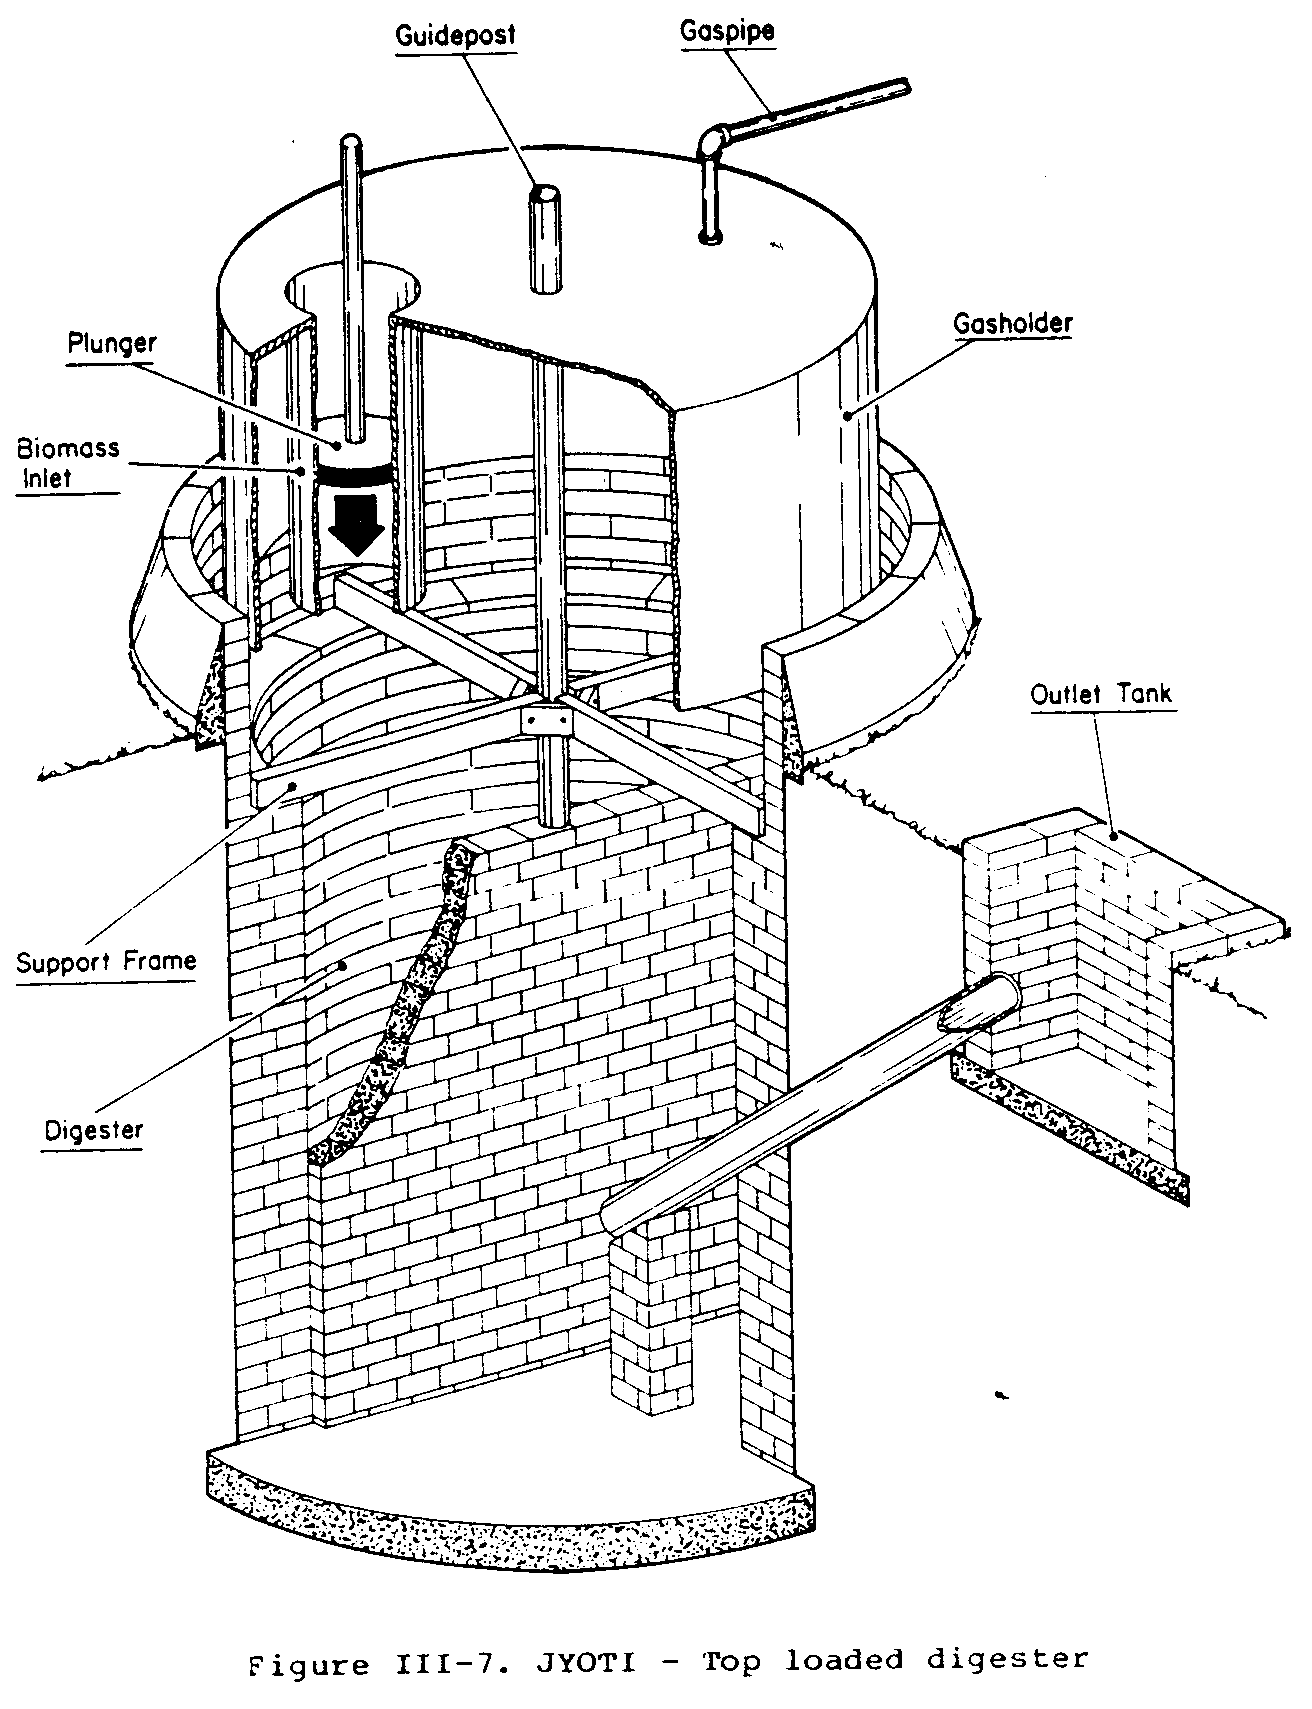
This ensures that the heavier, partially digested material settles to the digester floor unimpeded by the lighter biomass. The JSEI innovation could be an important breakthrough in the use of agricultural and forest residues in biogas systems. In addition to solving the problem of scum build-up, the JSEI technique also seems to eliminate the necessity of excessive shredding or drying of residues, making the handling of these materials far less cumbersome and time-consuming. Biomass is merely chopped into 2-3 cm (.75-1.25") squares and then is pushed into the digester through a cylindrical tube inserted into the floating gas holder. The tube is always in contact with the slurry, even with the dome at maximum height, so that no gas can escape.
There remain a number of questions concerning the relative performance of fixed-dome plants versus floating drum plants. Conflicting data have been reported concerning equipment life, material durability, gas production, delivered gas pressure, and installation and maintenance costs. The Department of Science and Technology has established five regional testing centers where different designs of similar capacity are being monitored under symmetrical, controlled conditions in different agro-climatic regions. One such station visited by the author, in Gandhigram, Tamil Nadu, appears to have insufficient resources to assess accurately the performance of the different biogas systems that have been constructed. More rigorous comparative research on fixed-dome plants is needed, especially after further design improvements, such as those done by ASTRA, are completed. The effects of agitation, digester wall protrusions, and partition walls to improve gas yield need to be analyzed in different digester designs. It is not yet clear if the cost advantages of fixed-dome digesters outweigh the performance advantages of floating-drum digesters. This may be a function of the uses of the gas in a particular village, which determines the relative importance of providing gas at a constant pressure and the effectiveness and cost of pressure regulators currently under development. More research is needed before any conclusions can be made.
There are numerous experimental digesters with modifications of the designs described in the preceeding discussion. MCRC is planning to link its biogas plants with other biotechnology projects, such as pisciculture, algae growth, and organic farming. The Indian Institute of Technology - Delhi Center for Rural Development and Appropriate Technology is developing a system that will grow algae in the supernatant of a fixed-dome system. It will recycle the algae to supplement the daily raw material charge. The system will provide fertilizer, gas, oxygenated water for irrigation, and animal nutrients such as single cell proteins for fodder.(48) The idea is to generate the maximum yield per unit of local resources. Integrated systems have a great deal of potential, although their often elegant simplicity requires a great deal of skilled operation and effective maintenance. IV. System Operation
The appropriate role of a biogas system in producing heat, light, refrigeration, and motive power can be determined after end-use energy requirements over time have been assessed carefully, including any anticipated demand from population growth. The system's capacity should be based on a careful analysis of costs, local climate and soil conditions, and the net availability of biomass. This latter consideration must account for competing uses of crop wastes and dung, animal diet, grazing habits, difficulty of biomass collection, and the availability of labor. Also, the probabilities of the survey data remaining constant over time must be assessed.
Many family-sized systems have been designed with insufficient capacity to produce gas when it is needed at different times during the day or year. In India's colder northern climates, the drop in gas production during winter often has been underestimated. Great care should be exercised in preparing plant feasibility studies so that different contingencies can be accommodated without disrupting the operation of the system. For example, farmers often sell cattle during droughts (if the cattle survive), and this obviously reduces dung availability. Baseline surveys of available biomass can be distorted if conducted during periods of exceptionally good harvests or failed monsoons.
It probably is wise to build two or more medium-size plants in a village rather than one large plant, even though the total cost may increase. If problems or maintenance force a temporary shutdown in one of the digesters, the entire system will not be disrupted. If small-scale, fixed-dome system costs call be reduced to around Rs 400-500 (US$50-62), which does not seem impossible, clusters of small systems might be a more cost-effective way to provide energy than one large system. Some of the complexities of planning village energy systems are discussed in the following section on the economic analysis of biogas systems.(49)
Biogas plants require certain care during their initial starting up or "charging." If a digester contains a partition wall, slurry must be added from both the inlet and outlet tanks to equalize pressure and prevent collapse of the wall. While not essential, introducing either composted manure or digested slurry as seed material to the digester will speed up the initial charging. There is some disagreement over how best to start up a plant. One suggestion is to fill the digester as rapidly as possible until the outlet tank begins to overflow,(50) ensuring that the seed material is twice the volume of the fresh biomass initially fed into the system. Another is to increase gradually over a three-week period the amount of biomass mass introduced daily to the system.(51) The inlet and outlet tanks are then covered and digestion begins.
This chapter presents certain points that are not usually covered in discussions about biogas systems. The author recommends John Finlay's Operation and Maintenance of Gobar Gas Plants[N] (1978) for a more complete description of how biogas systems operate.
The plant should begin producing gas within 7-20 days, depending on temperature, agitation, etc. This initial gas is largely [CO.sub.2] and should be released into the atmosphere; it will burn poorly, if at all. This step may have to be repeated. Within a month after charging, however, the system usually will have developed a kind of critical mass of bacteria that is stable enough to digest the daily biomass charge and produce gas.
Care should be taken to ensure that the biomass fed into the system is relatively free from sand, gravel, and coarse fibers. Many inlet tanks have a floor that slopes away from the opening through which material flows into the digester. The opening is blocked during slurry mixing and the slurry is allowed to settle for several minutes. The plug is then removed and, as the slurry drains into the digester, heavier sediments and foreign matter collect at the lower end of the sloped inlet tank floor. This material can be removed after the slurry has drained into the digester. Material should be mixed thoroughly. Shredders, screens, and mixing devices may be required for village scale systems that handle a large amount of different raw materials. These precautions are recommended to reduce the chances of the digester becoming clogged in either the inlet or outlet tanks, or of having a scum layer form in the digester itself. More research is needed to understand the sensitivity of biogas systems to variations in the biomass charge. Similarly, ideal rates of loading different materials at different temperatures need to be determined. Many of the guidelines for operating biogas systems are based on trial and error observation in the field. The systems work, but their efficiency could be increased and their costs reduced.
Systems should be built in a sunny area to take advantage of solar radiation. They should be at least 5-10 meters from a source of drinking water sources, especially if human wastes are used. This is particularly important with large-scale systems, which could represent concentrated sources of enteric (intestinal) pathogens if they leak. Adequate space should be provided for raw material and water-mixing as well as for slurry handling and storage. Land and water requirements are a critical and often underemphasized part of a biogas system.
Care must be taken to minimize water condensation in the gas lines (possibly by including water traps), isolate sparks and flames from the gas lines (by including flame traps), and prevent pipe freezing in winter. Provision must be made for frequent inspection and maintenance of the system (including pipelines). There also must be proper handling of the slurry to conserve nutrients and minimize contact with pathogens in both the influent and effluent.
If a biogas system is not performing as it should, the following trouble-shooting sequence is suggested.(52)
1. Check temperature of the influent mixture. Sudden cooling of the slurry in the digester can impede microbiological digestion. Temperature variations should be kept to a minimum.
2. Check loading rate of organic materials. Overloading will cause material to flow out of the digester before the slurry has been digested.
3. Check pH levels, which may drop below the 6.0-7.0 minimum. Add lime to increase the pH level, if necessary.
4. Check for toxic material in the influent, and alter the composition of materials - mixed in the slurry.
Whenever daily feeding procedures are altered, the change should be introduced gradually so that the microbial population has time to adjust to the new environment.
V. Gas Distribution and Use
Gas distribution systems can cost from several hundred rupees for a family system to as much as three/fourths the total cost of a village scale digester (exclusive of pumpsets, engines, generators, etc.). Distribution costs can offset the scale economies of larger digesters. The distribution system in a particular village will be determined by local conditions, e.g., the distance between the points to which the gas must be distributed (houses, pumpsets, or industries), the availability of organic material, the difficulty of collection, and the availability and cost of construction materials.
Because the gas is usually released from a floating drum holder at a pressure of less than 20 cm of water column, the total length of the distribution pipeline is probably limited to less than 2 kilometers unless booster pumps are used, which increases costs. As delivery pressure decreases with pipeline distance, the flame velocity gradually becomes too low to support a stable flame. Similarly, pumpsets for biogas that are too far from the digester will require either an expensive pipeline, a gas storage vessel/bag of some sort, or possible conversion of the biogas to electricity.
Many different materials have been used in constructing pipelines, such as GI pipe and PVC or HDP plastics. It would seem possible to use clay or earthen pipe as well. Problems of gas leaks, durability, and rodent damage vary with material characteristics and care in construction. Generally, plastic pipes with a diameter greater than 35 mm seem best for cost optimization, ease of construction, and favorable friction characteristics to aid in gas flow.(53) The availability of large quantities of plastic piping may be a problem in certain locales.
One way to reduce the cost of pipelines might be to use the same pipeline for delivering drinking or irrigation water as well as gas.(54) Water condensation in the pipeline would have to be monitored carefully, as would any possible health hazards.
There are several descriptive accounts from China and Sri Lanka of using bags to store and transport gas to run pumpsets and tractors, and possibly to meet household cooking and lighting needs.(55) Kirloskar Oil Engines, Limited, is experimenting with a rayon-coated rubber bag that has enough capacity to power a 5 hp pumpset for two hours. It would cost approximately Rs 500 (US$40). The general problem with such bags is that they must be large enough to enable the gas to be released at the 10-12 cm water column pressure that is required for stove or engine use. Unless compressed in some way, a bag to provide enough gas for the daily cooking and gas requirements for a single family would have to be almost as big as the hut to which it was attached. In addition, the safety and durability of such a system are debatable, given the rigors of village use and the susceptability of such a system to vandalism. Despite the presence of [CO.sub.2] in biogas, puncturing a bag in the vicinity of a flame could cause a large fire. The danger is magnified if the gas is purified by bubbling it through time to increase its calorific value.
Nonetheless, a centralized delivery scheme where a few "regional" pipelines are laid near clusters of huts, and from which individual consumers fill their own storage bags, might have certain advantages. It may ultimately be cheaper than a full-scale pipeline system. It could expand easily if demand increased, and would free families from being restricted to using gas only during certain times of the day. Most community systems have several uses for gas and deliver gas only during fixed times of peak demand, especially during morning and evening cooking periods. This staggered delivery is designed to minimize gas waste, but can be inconvenient for villagers, who occasionally have to work during the time gas is delivered in their area.(56) A decentralized "gas bag" system might facilitate plant management and the easy monitoring of gas consumption. It might also allow for more efficient use of the gas. There are problems with this concept, but it has not yet received adequate attention from biogas system designers.
The costs of pressurized biogas cylinders, similar to Liquid Propane Gas (LPG), seem prohibitive. Biogas can only be liquified at -83 [degrees] C (-117 [degrees] F) and at a pressure of approximately 3.2 meters of water column. Reddy has estimated that such a gas cylinder system could almost double the cost of a pipeline in Pura village.(57) It is doubtful that individual families would have sufficient capital to purchase cylinders (Rs 300-700/cylinder). However, this concept should not be completely dismissed. The revenue-generating potential of a large-scale biomass system might justify an investment in a pressurized gas cylinder system. The compressor itself could be powered by the biogas system.
Using biogas for cooking is more complicated than the literature suggests. KVIC (1980), Finlay (1978), National Academy of Sciences (1977), Bhatia (1977), the Indian Council of Scientific and Industrial Research (1976), and Parikh and Parikh (1979) all suggest that gas requirements for cooking vary between 0.2 and 0.4 [m.sub.3]/person/day, although some anecdotal field reports suggest that these figures may be high.(58)
The difficulty in establishing norms for gas required for cooking is due to our scanty knowledge of rural cooking habits. The key to formulating cooking norms is to determine the usable or net energy used by a family to prepare meals. There are several levels of analysis needed to generalize about net available cooking energy. Diet varies regionally according to climate, custom, income, etc. Even the quality (calorific value) of identical fuel sources, such as firewood, varies regionally. Finally, the efficiencies of stoves (often a group of stones), and consequently the thermal efficiencies of different fuels, are also highly variable.
A detailed investigation of these variables would begin to shed some light on village cooking needs. These are more difficult to determine than the cooking needs of a wealthier farmer, who is the most likely consumer of a family-sized biogas plant, and on whom data do exist. At the moment, there is no accurate way to generalize about the gas required for village cooking. KVIC did attempt to generate data on the calorific value, thermal efficiency, and "effective heat" of different fuels,(59) but no description of its methodology is included in its report. It also assigned calorific values of biogas and wood, which conflict with other analyses, thus leaving KVIC information open to question.
Gas requirements for cooking can affect significantly the performance and economic viability of a village system, depending on competing uses for the gas. This is especially true if non-cooking uses of biogas are a source of revenue. More research and development are needed on cooking burners, stoves, and cooking vessels (and on their heat conducting properties), which collectively affect the efficiency of gas consumption. The relative system efficiencies of metal and terracotta cookware need to be analyzed. Though metal is a better conductor of heat, it also cools faster. Terracotta vessels take longer to heat yet they retain their heat. Rice cooked in terracotta vessels often is cooked only until half-done. The vessel is then removed from the fire, and the remainder of the cooking is done with the heat that radiates from the walls of the terracotta vessel. This is why both energy consumption and cooking costs need to be analyzed with respect to cooking systems, i.e., the fabrication of all utensils, their collective thermal properties, the costs of the various components (energy source, stove, vessel) over their useful lives, and the nature of the foods or liquids being heated.
The Gas Crafters' iron burner recommended by KVIC costs Rs 100. Though "rated" at 60 percent efficiency, there have been complaints about its air valve becoming clogged with fat and oil, and that not all cooking vessels rest upon it equally well. Developing and Consulting Services, Butwal, Nepal, claims to have both improved this design and reduced its cost to Rs 80.(60) There have been other attempts by the Gandhigram Trust and PRAD to develop simple ceramic burners for as little as Rs 20, but these are still experimental and little is known about their performance or durability. There are many photographs of a variety of ceramic, bamboo, and stone-filled tin can burner designs from China,(61) but again, no performance, durability, or cost data exist. The stove used for cooking with biogas may itself have to be modified to achieve maximum efficiency. The Chinese often seem to set their cooking vessels on top of simple burners in deep stoves that surround the vessels, thereby using heat more efficiently.(62)
Social or cultural factors must be considered when designing a distribution system. The flame properties of biogas make burners difficult to light unless a cooking vessel is resting on the burner prior to lighting the gas. This can conflict with certain religious ceremonies that reverse the procedure as part of the need to show reverence toward fire.(63) Village cooking requirements may be significantly affected by season. In many areas, when labor demand increases during harvesting and planting, groups of workers are fed at staggered times throughout the day. During these peak times, stoves often are kept hot all day for as long as two months of the year. Such increases in cooking energy requirements need to be studied by anyone involved with the establishment of a village system.
The decision to use gas directly for lighting gas lamps, as opposed to running a diesel generator to produce electricity for electric lights, depends on the local demand for electricity. Ghate found that while electric lighting consumed less gas than direct gas lighting, gas lamps are far cheaper in terms of cost per delivered candle power. Electric lights are brighter and more reliable than gas lamps. Roughly .13 [m.sup.3]/hr of gas is needed to energize one gas lamp. Slightly less gas is needed for electric lighting, depending on the generator output.(64) Ghate admits that his data are open to question and that the high cost of electric lighting might make sense if a generator also was used for other operations.
Biogas has been used successfully to power all types of internal combustion engines. This raises the technical possibility of biogas providing energy for rural agriculture as well as for industrial machinery and transportation. There are various reports of tractors powered by methane stored in huge bags towed behind the tractor. The practicality and economics of such a scheme are open to question, given little hard data. Stationary motive power for operating pumpsets, milling and grinding operations, refrigerators, threshers, chaffers, and generators, etc., seems to be a more appropriate match between energy source and end-use demand. Petrol engines have been run solely on biogas by the KVIC, several of the Indian Institutes of Technology, and PRAD, among others. Since most agricultural engines are diesel powered, the remainder of this discussion will be confined to biogas-diesel (dual fuel) engine operation. The use of biogas in engines could be of great importance to rural development projects, providing motive power to areas where the availability or cost of commercial energy (diesel fuel or electricity) has precluded mechanized activities.
A diesel engine carburetor is easily modified to accommodate biogas. The necessary conversion skills and materials exist in most villages. Kirloskar Oil and Engines, Limited has marketed dual fuel biogas-diesel engines for several years at a price roughly Rs 600 more than regular diesel engines. Their line features a modified carburetor and a grooved head for swirling the biogas, which was found to improve performance. Kirloskar does not sell the carburetor separately. The firm encourages farmers to consider "the option" when they purchase a new engine. Kirloskar engineers report that good engine performance occurs with a biogas to diesel mixture of 4:1, which works out to .42 [m.sup.3] of biogas per BHP/hr.(65) In actual operation, the ratio may exceed 9:1. The mixture is regulated by a governor that reduces the amount of diesel flow as more gas is introduced, keeping power output constant. There is an observed drop in the engine's thermal efficiency with greater gas consumption. However, research at IIT-Madras has shown that this may be due to the leanness of the biogas mixture. Reducing incoming air improves performance except at full power output. Generally, efficiency increases with power output.(66) The gas should be delivered to the engine at a pressure of 2.57-7.62 cm water column.(67) Removal of [CO.sub.2] also improves engine performance.
Biogas makes engines run hotter, and therefore proper cooling is important. Biogas slurry should not be used to cool engines since the suspended solids can clog the cooling mechanism and act as an insulator, thereby trapping heat. Air-cooled engines must be used if slurry is mixed with irrigation water that normally would be used as a coolant.
There is little available data on the potentially corrosive effects of the [H.sub.2]S present in biogas, although engines have been run for some time with no reported corrosion. Iron filings can be used to filter out [H.sub.2]S. In addition to the reduced operating costs for fuel engines, removing [H.sub.2]S has produced the following benefits:
1. Reduced emission of CO.
0 2. Increased engine life (up to four times normal life).
3. At least a 50 percent reduction in maintenance costs due to longer life of lubrication oil. Freedom from gum, carbon, and lead deposits.
4. Lower idling speed and immediate power response.(68)
When energy conversion efficiency losses are calculated for diesel generators, roughly 1 kwh is generated for every 0.56 [m.sup.3] of biogas. A 15-KVA diesel generator (12 kw) running two 3.75 kw electric pumps (5 hp) for eight hours a day would require almost 53.8 [m.sup.3]/day, compared to 33.6 [m.sup.3] if the pumps were powered with dual fuel engines. This is because of the difficulty of finding electrical generators that are matched exactly to peak power requirements.
Slurry Use and Handling
The effluent from a biogas plant can be either sludge, supernatant, or slurry depending on the design and operation of the system. Most Indian systems have slurry as their output. The remainder of this discussion pertains to slurry that is formed primarily by mixing dung and water, although it probably applies to any digested biomass.
The main advantage of anaerobic digestion is that it conserves nitrogen if the slurry is handled properly. Though approximately 20 percent of the total solids contained in the organic material are lost during the digestion process, the nitrogen content remains largely unchanged. The nitrogen is in the form of ammonia, which makes it more accessible when the effluent is used as fertilizer. Aerobic digestion, on the other hand, produces nitrates and nitrites. These are likely to leach away in the soil, do not become as readily fixed to clay and humus, and are not as easily used by water-borne algae.(69) Bhatia cites earlier observations that the amount of ammoniated nitrogen increases to almost 50 percent of the total nitrogen content of anaerobically digested dung, as compared to 26 percent in fresh dung.(70)
The quality of organic manures is greatly affected by handling and storage methods. Table V-1 shows nitrogen loss related to storage time.
Biogas slurry can be handled in any of the following ways, with the choice depending on both cost and convenience:
1. Semi-dried in pits and carried/transported to the fields.
2. Mixed with cattle bedding or other organic straw in pits to absorb slurry, and then transported to the fields.
3. If a high water table exists and (1) or (2) are done, then the "reformed" slurry that has been mixed with ground water can be lifted out of the pit in buckets and dried further.
4. Applied directly to fields with irrigation water or through aerial spraying.(72)
Table V-1(71) Nitrogen Lost Due to Heat and Volitilization in Farmyard Manure (FYM) and Biogas Slurry
Loss as Percentage Manure of Total N
FYM applied to fields immediately 0
FYM piled for 2 days before application 20
FYM piled for 14 days before application 45
FYM piled 30 days 50
Biogas slurry applied immediately 0
Biogas slurry (dried) 15
Biogas slurry can be a problem to store and transport, depending on local land use, the amount of effluent produced daily, the distance from the digester to the fields, and the willingness of workers to handle slurry and deliver it to either household pits or fields. There may be some merit to evaporating the water from the slurry, thereby reducing storage space requirements, and then recycling the water back into the biogas system. This should aid the digestion process, facilitate slurry handling, and reduce net water consumption.
The following are additional benefits of using biogas slurry:
* Potentially decreasing the incidence of plant pathogens and insects in succeeding crops.(73)
* Speeding the composting process by using additional organic materials that can be added to a compost pit.
* Reducing the presence of odor, white ants, flies, mosquitoes, and weed seeds in the compost pits.
* Making it difficult to steal manure.(74)
It is necessary to compare the nutrient content of biogas slurry with that of other composting methods to determine the best use of resources and evaluate alternative investments. A well-managed compost pit may yield manure that is only marginally inferior to that from a biogas system. The cost of a biogas system must be compared with the utility of its effluent. There is a great deal of confusing literature on the subject, which analyzes fertilizer contents, handling, and application methods. More scientific research in this area is needed so that accurate comparisons between different composting methods can be made.
The most practical and perhaps most useful kind of research would be to study field conditions by applying chemical fertilizers, composted manures, and digested slurry to experimental plots and carefully monitoring the crop yields for each group. There have been reports from China indicating that use of biogas slurry increases crop yields 10-27 percent per hectare compared areas that receive manure that is aerobically composted.(75) Unfortunately, and as is the case with much of the literature on the Chinese experience, there is insufficient data to substantiate descriptive reports. In any case, care should be taken to ensure that handling and application techniques follow exactly either those methods currently in use in villages or those that could easily be adopted by villagers. Too often, the laboratory tells us nothing about actual practice in the field.
VI. Economic Analysis of a Village System
Numerous articles and books, have attempted to examine the economics of biogas systems.(76) Most of these analyses have been concerned with family-scale systems, hypothetical village systems, or the Fateh Singh-Ka-Purva system in Uttar Pradesh. Often the conclusions of these studies are based on certain critical assumptions over which, not surprisingly, there is considerable disagreement. These assumptions range from values assigned to capital and annual costs, calorific values for fuels, and thermal efficiencies, to per capita energy consumption, market prices, and the opportunity costs of labor, energy, organic residues, and capital. The nutrient content and end-uses of different organic materials also are subject to debate.(77)
It is beyond the scope of this study to untangle these disagreements. Many of them are due to our limited knowledge of rural life. Others are rooted in basic disagreements over "correct" economic theory, which sometimes approach the level of a theological dispute or metaphysical debate in which one either "believes" or "does not believe." This is especially true in the cases of social rates of discount and opportunity costs. Such questions employ many economists, and it is unlikely that the following discussions will either threaten those positions or reconcile such divergent opinions.
Many economic studies attempt to assess the overall impact of the large-scale adoption of biogas plants. These include the costs and benefits to society as a whole, as well as the macro-level resource demands for steel, cement, manpower, and other factors required for a massive biogas program. Such analysis is valuable when the range of costs and benefits of individual and village systems is known. However, this range cannot be determined accurately at the present time because so little is known about rural energy consumption patterns.
The analysis presented here has the relatively modest objective of assessing the performance of a particular biogas system in a particular village. It studies a large village-scale system. Such systems have been more exhaustively analyzed than small family plants, and also hold more promise for realistically meeting the energy needs of the rural poor. Two measures of performance will be examined.
1. The net impact of the biogas system on the village economy as a whole, determined by the net present value (NPV) of quantifiable annual benefits minus costs. NPV measures the value of future benefits and costs and discounts them back to the present using a given interest rate.
2. The ability of the biogas system to bring in enough revenue to ensure its self-sufficient operation. This is measured in terms of an undiscounted payback period derived from annual income minus annual capital and operating expenditures.
These two performance measurements are useful in determining if the village "product" is increased as a result of the introduction of the system and if the system can pay for itself. Four limits to these measurements require further discussion.
1. There are serious shortcomings to such social benefit-cost analyses due to the difficulty of quantifying many of the effects of a project.(78) For example, some important values pertaining to this study are difficult to measure:
* Labor freed from gathering firewood or other fuels, and from cooking meals. The greater amount of useful energy from biogas could reduce the time required for cooking by one-half to two-thirds.
* Decreased incidence of eye and lung diseases and irritations, improved cleanliness in the kitchen, and greater ease in cleaning cooking utensils due to the clean burning biogas. This is in sharp contrast to chulahs, which spread smoke and carbon deposits throughout the kitchen area.
* The improved quality and quantity of food consumed due to crop yields that are increased because energy is available for water pumping, and because the nutrient and humus content of the slurry make it a better fertilizer than that derived from traditional village composting methods.
* Freeing manure piles from white ants, weed seed, and odor, and making the manure more difficult to steal due to its semi-liquid state. Theft of manure has been a problem in some villages where the manure is scarcer than in the village under study here.
* Effects of better lighting on education by creating more time for readinq and study, on the possible reduction in birth rates, and on increased equality among villagers because prestigious electric lighting is available to all.
* The increased sense of confidence and self-reliance that a successful biogas system might instill in the villagers, with the long-term potential for greater intra-village cooperation, innovation and invention, and employment generation and investment.
* Changes in the demand for various resources such as fossil fuels, chemical fertilizers, etc., and some secondary effects associated with these changes such as foreign exchange requirements, release of atmostpheric hydrocarbons, rate of soil depletion, and deforestation. Overall soil quality might increase if large quantities of biogas slurry, which is rich in nitrogen and humus, were spread over the fields.
* Development of rural industries that require a cheap, dependable energy supply, such as biogas.
* Impact of the system on the village distribution of income, which may vary according to income, cattle, and land ownership.
All of these important effects are excluded from the analysis because of the difficulty of assigning a cardinal value to them. This results in lost data and will distort the cost and benefit calculations.
2. Net present value (NPV) calculations suffer from a number of theoretical limitations, the most serious being the inability of an NPV figure to represent fully the real utility of a project. Certainly, a negative or zero NPV indicates that a project is not worth pursuing. However, a positive NPV, even if quite large, does not necessarily imply that a project should be implemented. The NPV of a particular project must be evaluated along with the NPV of all other projects that could be implemented with the same factor inputs of natural resources, labor, and capital. However, these other projects may or may not achieve similar goals. The criteria used to select projects may themselves vary according to the perceived priority of the goals. This often depends on who is doing the perceiving. A landless peasant, a block development officer, or a social scientist all may have quite different ideas about the needs of the poor. Such are the methodological and political complexities of determining the best use of resources. This problem is fundamental to development planning.
3. Even if one project stands out among many as having the greatest NPV, this tells us nothing about the critical problems of cash flow and access to capital. The inclusion of cash flow and payback data in the economic analysis that follows is presented to help remedy this deficiency. However, even a project that seems financially viable is not automatically guaranteed access to capital. Local and national politics, lending institutions' perceptions of the project's risks, and/or government perception of a project's importance (which affects a variety of possible incentives such as price controls, subsidies, loan guarantees, taxes, compulsory legislation, etc.) dramatically influence a project's financial viability. The problem of access to capital is excluded from the analysis.
4. All prices used in these calculations are market prices, which are affected by the performance of the larger economy - inflation, material availability, infrastructure performance, government price setting, etc. Shadow price calculations do not alter the fact that benefits and costs will occur within the prevailing economic context. These benefits and costs may be subjected to many political and economic distortions. Thus, any analytical framework for assessing the project may well distort the "real" impact of the project. On the other hand, while reliance on prevailing prices and rates of discount may reduce the precision of the following analysis, it does account for the actual market constraints that a village biogas system would face, defining minimal performance requirements.
The village system discussed in the following analysis is being constructed by the ASTRA group in Pura Village. It will incorporate advanced design features and be self-supporting in terms of its annual operating costs. (The Karnataka State Government is providing the capital investment.) The data base for the analysis is obtained from A.K.N. Reddy, et al., A Community Biogas System for Pura Village (1979).
ASTRA has provided information on Pura village and cattle population, cooking needs, dung availability, and some of the biogas system component costs. Unfortunately, much of the actual data necessary for an accurate analysis are simply not available. All estimates and assumptions are explained in detail and are the sole responsibility of the author, who is grateful to Dr. Reddy for his kind permission to use some of the preliminary data in this study. Readers should note that conclusions that may be drawn from the following discussion should in no way be used to judge the performance of the actual system under construction in Pura. The following analysis proceeds from certain assumptions that differ slightly from those upon which the Pura system is based. Some of the data and cost estimates for the actual Pura system will be subject to revision. Nonetheless, the available data from the Pura system will enable us to obtain a fair picture of how well a village biogas system will fare financially.
The ASTRA biogas system under construction in Pura village has four main functions:
1. Provide cooking gas for each household.
2. Operate a pumpset for 20 minutes a day to fill an overhead storage tank with water. This should satisfy village domestic water requirements and provide the water needed to dilute the dung and clean the inlet and outlet tanks.
3. Operate a generator for three hours to provide electric lighting in the 42 households that currently are not connected to the central grid.
4. Operate a dual fuel engine to run a ball mill as part of a rice husk cement manufacturing operation.
The original feasibility study for Pura specified the construction of a single 42.5 [m.sup.3] ASTRA design digester with a mild steel floating-drum gasholder. It would provide enough biogas for all the above operations. The release of gas would be synchronized with various end-uses throughout the day. The 42.5 [m.sup.3] capacity was determined by the biogas requirements of the various system tasks, and allowed for some population increase.
The ASTRA team estimated that the 56 households (357 people) in Pura would require 11,426 [m.sup.3] of gas per year for cooking. This averages about 0.088 [m.sup.3] per person per day. Although this is less than the 0.2-0.3 [m.sup.3] per person per day norms cited by KVIC and others, we will assume that ASTRA's figure is correct for the level of subsistence and diet in Pura village.
The annual gas required to operate all of the engines is estimated at 3,767 [m.sup.3]. This is calculated as shown in Table VI-1 on the following page.
Total system requirements for cooking and engine operations are 15,193 [m.sup.3] of gas per year. Based on ASTRA observations, an estimated average of 7.35 kg fresh dung per animal can be collected from the night droppings of tied cattle. Added to this figure is an estimated 401.5 kg of collected organic matter--which also could be 2.65 kg more dung per head. This gives an equivalent of 10 kg of dung or dung equivalent per animal per day. Regardless of the actual amount of biomas fed into the system, a 5 percent loss is assumed in collection and handling. So, of the 532,900 kg available, 506,255 kg/biomass/year is actually used. This is roughly 1,387 kg/biomass that could be fed into the system daily. These estimates are very conservative. Cattle population is held constant, and cropping patterns are unchanged from the present mix. Both of these factors are likely to change during the life of the system in a way that probably will increase the availability of biomass.
The maximum amount of gas produced from these estimates of Pura's available biomass is described in the analysis as the maximum output scenario. The cost of a system designed to produce only enough biogas to perform specified tasks is described as the minimum cost scenario. The two scenarios differ in the amount of biomass that will be fed into the system. This affects the required digester volumes and digester costs.
Table VI-1. Annual Gas Requirement
Function Gas Requirement
1. Water pumping (20 minutes/day) X (.42 [m.sup.3] gas/ BHP/hr) X (5 hp) X (358 days) = 251 [m.sup.3]
2. Operating diesel gener- (3 hr/day) X (.42 [m.sup.3] gas/BHP/hr) ator for lighting X (5 hp) X (358 days) = 2,256 [m.sup.3]
3. Operating ball mill for (2 hr/day) X (.42 [m.sup.3] gas/BHP/hr) rice husk cement manu- X (5 hp) X (300 days) = 1,260 [m.sup.3] facturing
TOTAL 3,767 [m.sup.3]
The system is shut down one week each year for repairs, cleaning, etc., which may become less over time. It is assumed that there is no unforseen vandalism, natural disasters, etc.
The daily biomass charge is determined by the gas requirements of the tasks to be performed. It equals the daily gas demand for all uses divided by the gas yield per kg of biomass. The analysis considers three different levels of demand, which correspond to three different biogas systems. For each of these three systems, which are described as Models 1, 2, and 3, both the minimum cost and maximum output scenarios are examined. It should be noted that the digester with sufficient capacity to digest all the net available biomass--the maximum output scenario--is identical for all three models. Because the gas demand is different in each model due to the different tasks performed, any surplus gas that will be available in the maximum output scenario will vary with each model, even though the digester costs will remain constant.
The three models are described below:
Model 1: Provides enough biogas for cooking, electric lighting, and domestic water requirements for the village, as well as water to operate the biogas system.
Model 2: Provides gas for cooking, electric lighting, water, and operating the ball mill to grind rice husks to produce rice husk cement.
Model 3: Provides gas only for electric lighting and the rice husk cement operation. Table VI-2 shows the gas and biomass requirements for the models, based on earlier calculations.
The Pura village plan calls for two digesters of roughly 21.5 [m.sup.3] capacity each. Two smaller systems were decided upon after a risk analysis demonstrated that this reduced the "downtime" the system due to repairs and maintenance. At a given moment, only one of the digesters should be out of service so that service will not be disrupted completely, as would be the case with one large digester. As described in Table VI-1, the system is assumed to have an annual repair and maintenance period of one week.
The system used in the following economic analysis is based on the redesigned ASTRA system with one major modification: the analysis assumes that a small volume of water covered by a sheet of polyethelene is held on top of the gas holders by retaining walls similar to the ASTRA design described earlier. The polyethelene is treated for ultraviolet radiation. This simple solar water heater reduces system cost and improves performance due to the increased gas yield that can be expected from "hot charging" the slurry mixture. Field reports indicate that the "hot charge" system, when combined with the practice of mixing dung with other organic materials, could easily increase gas yield by 25 percent.
This means the biogas system, which normally would produce gas at the rate of roughly .038 [m.sup.3]/kg of fresh biomass, now has a gas yield of .0475 [m.sup.3]/kg of fresh biomass. This is a very conservative estimate. Empirical results may show that gas yield almost doubles. While actual gas production rates will fluctuate slightly due to seasonal ambient temperature changes, the gas yield of .0475 [m.sup.3]/kg fresh biomass represents an average or minimum gas production figure, and is used for year round calculations.
A number of system costs need to be described in detail, since they differ for each of the models. The capital costs for two biogas systems that each have half the total system capacity, and which are built with ferrocement gas-holders and solar water heater attachments, are shown in Table VI-3. Information is based on detailed calculations and discussions with ASTRA biogas engineers. Table VI-4 shows system costs in addition to digester costs.
ASTRA surveys also indicate that approximately 150,000 kg of firewood are collected for cooking purposes. Of that, 4 percent is purchased at Rs 0.04/kg. While time spent gathering firewood is reduced by almost 36,950 hours, the direct annual monetary savings that accrue from the biogas system's operation are only about Rs 240 (150,000 kg of firewood) X (4 percent purchased) X (Rs .04 kg firewood) = approximately Rs 240. Despite a relative
Table VI-2 Gas and Biomass Requirements for Different models Under Minimum Cost and Maximum Output Scenarios (in [m.sup.3] per day)
Model 1, Model 2, and Model 3
Cooking, Lighting, Lighting, Pumping, Cooking, Lighting, Pumping, and Ball and Ball Mill and Pumping Mill Operation Operation
System Design Minimum Maximum Minimum Maximum Minimum Maximum Scenario Cost Output Cost Output Cost Output
Cooking 31.3 31.3 31.3 31.3
-- Water Pumping 0.7 0.7 0.7 0.7 0.7 0.7 Lighting 6.3 6.3 6.3 6.3 6.3 6.3 Ball Mill -- -- 4.2 4.2 4.2 4.2 Surplus Gas -- 26.7
22.5 -- 53.8
Total Gas Required (Approximately) 38.3 65.0 42.5 65.0 11.2 65.0
Total Annual Biomass Required 294,306kg 506,255kg 326,579kg 506,255kg 86,021kg 506,255kg (fresh dung equivalent)
Note: Biomass required for each model is based on a gas yield of .0475 [m.sup.3]/kg.
Table VI-3 Biogas Digester Capital Costs for Models 1-3
Model 1, Model 2, and Model 3
Minimum Maximum Minimum Maximum Minimum Maximum Cost Output Cost Output Cost Output
Daily Gas Capacity ([m.sup.3] 38.3 65.0 42.5 65.0 11.2 65.0 Digester System Cost 13,400 22,100 15,000 22,100 4,500 22,100 (Rs)
Table VI-4 System Costs for models 1-3 (in Rs)
Model 1, Model 2, and Model 3
Equipment
5 hp engine and 15,500 15,500 15,500 KVA generator Electrical system 5,500 5,500 5,500 Pumpset 700 700 700 Ball mill -- 4,750 4,750 Shed for equipment 3,000 6,000 6,000 Water tank 550 550 550 Miscellaneous (including 8,000 8,000 8,000 roughly Rs 1,500 for technical supervision) Subtotal 33,250 41,000 41,000 Gas pipeline for village 10,000 10,000 -- Total 43,250 51,000 41,000 abundance of forests, Pura villagers spend an average of three hours per day collecting firewood. In other areas, where deforestation pressures are far more serious, the price of firewood would be much higher, increasing the value of savings from reduced firewood consumption. In such areas, more dung would be burned as fuel, so greater benefits would be realized by recapturing the fertilizer value of the dung. Another possibility might be that some of the Rs 8,000 used to purchase miscellaneous material for Model 3 could be freed up, since items like pipe fittings, valves, etc., would not be needed if the distribution pipeline were not constructed. Some of these savings could be used to purchase improved wood-burning stoves that could reduce firewood consumption by as much as 50 percent. This would amount to only Rs 120 in total reduced village firewood purchases, but would save more than 18,400 hours in collecting firewood. Additional benefits and costs that might accrue from the creation of village woodlots have lot been considered.
No direct government subsidy for the biogas system is considered in this analysis. There may be some cases where the NPV of the system in a village is positive, but the system generates insufficient cash flow to be viable financially. Such cases might justify a possible subsidy if shadow prices and shadow wage rates are included in the NPV calculations and the NPV remains positive.
It may be possible for Pura villagers to form an "association" if they can prove that the project will largely benefit the poor. Indian lending institutions can be somewhat flexible about the criteria used to determine if a particular group can qualify as an "association." Associations are eligible to obtain loans at 4 percent interest. We have assumed such eligibility in our calculations, although the effects of a loan at 10 percent also have been analyzed. To simplify calculations, it has been assumed in the analysis that loans will be amortized over 5 years, in equal installments, with a one-year grace period. The equal installments are calculated using coefficients from standard annuity payment tables. For a 4 percent loan paid back over 5 years in equal installments, the annual payment equals the total borrowed capital divided by 4.452. For a loan at 10 percent with similar terms, the annual payment equals the total borrowed capital divided by 3.791. The use of annuity formulas tends to spread capital costs over time, increasing the NPV of a project. The distortions caused by this simplified way of calculating loan payments are very small in this analysis due to the large operating costs of the system. In addition, the impact of inflation on the various costs and benefits has been ignored. Rural wage rates are the largest component of operating costs, and are not expected to rise significantly. If they did rise, the increase probably would be canceled out by the increased savings caused by the reduced consumption of increasingly costly commercial fuels.)
We have assumed further that dung is provided to the system free of charge except for labor costs, which are discussed below. Slurry also will be distributed freely on the basis of the amount of dung contributed by each household. We have assumed that water and land will be made available for free to the system by the villagers who have agreed to do so as a demonstration of their willingness to participate in the project.
At the time of this writing, there was little information readily available on the distribution of and crop yields from land holdings in Pura. Given a village of Pura's size and population, the land under cultivation could be approximately 60 hectares. A typical yield of rice paddy for these holdings would be 1,500 kg/hectare/year. An estimate of the average price a farmer obtains for this paddy is about Rs 90/quintal (100 kgs). There is no information on the percentage of agricultural production consumed by the villagers themselves versus the percentage that might be sold in markets outside the village. To simplify the calculations, we will assume that the village consumes all that it grows. Furthermore, we will assume that the nutrient and humus content of biogas slurry (consisting of at least all the dung currently applied as manure) is such that it has the net effect of increasing agricultural yields by 10 percent over those obtained through current fertilizer practices, even if these include the application of chemical fertilizers.
Increases of greater than 10 percent have been reported in China, where the extensive recycling of agricultural and animal wastes, including aerobic composting of wastes, is an ancient tradition. The 10 percent increase in yield is assumed to be a net increase over existing methods of "scientific composting." Thus, if the villagers sold the expected increase in crop yields, the net increase in village revenue from agriculture (IA), attributable to the use of biogas slurry equals (60 hectares) X (10 percent increase/hectare) X (1,500 kg of paddy/hectare) X (Rs 90/100 kg of paddy). This equals Rs 8,100 for the maximum output scenario. In the minimum cost scenarios, proportionately less revenue would be generated because less biomass would be digested. The specific IA's for the minimum cost scenario of each of the three models is calculated by multiplying Rs 8,100 by the ratio of biomass consumed in each minimized cost scenario. That figure then is divided by 506,255, which is the biomass consumed in the maximum output scenario in all three models.
This measure of the benefit of biogas slurry is used because it represents a tangible cash benefit. Many economic analyses derive monetary benefits from the use of slurry by assessing the nutrient content of biogas slurry, determining the equivalent quantity of chemical fertilizer, and converting this to a monetary benefit by multiplying the quantity by the unit price of chemical fertilizer. The problem with this method is that it implies that a farmer would have purchased the marginal equivalent amount of fertilizer. It is not clear at all that farmers would have made such purchases in the absence of available biogas slurry; whether the money is actually "saved" is a matter of debate. What is clear is that some increase in agricultural productivity will occur due to the superior nutrient and humus characteristics of biogas slurry. This will result in increased earnings. Even so, while the 10 percent increase in yield is a reasonable estimate, it needs to be corroborated by empirical results from field tests that also analyze the yield empirical alternative composting techniques. The increased agricultural productivity for the minimum cost scenario for each Model is calculated by multiplying the ratio of biomass required for the minimum cost system times the ratio of biomass required for the maximum output system times Rs 8,100, as explained earlier. The increased Agricultural productivity resulting from using the slurry in each of he minimum cost systems is shown below:
Model 1 = 294,306 kg X Rs 8,100 = Rs 4,709 506,255 kg Model 2 = 326,579 kg X Rs 8,100 = Rs 5,225 506,255 kg
Model 3 = 86,021 kg X Rs 8,100 = Rs 1,376 506,255 kg
According to ASTRA surveys, Pura village annually consumes 1,938 liters of kerosene, at Rs 2.25 per liter, for lighting. This annual expenditure of Rs 4,360 for lighting will be reduced as follows:
(42 households) X (40 watt bulb/house) X (3 hrs/days) X (358 days) X (Rs 0.44/kwh) = Consumption (C)
C = approximately Rs 791 1,000/kw
However, because the Rs 791 is paid by villagers to the village biogas operation, it also appears as a village benefit, i.e., income from the sale of energy. Therefore, the village as a whole saves all money previously spent on kerosene purchases (Rs 4,360). In terms of the cash flow position of the biogas system, the sale of electricity for lighting is treated as revenue of approximately Rs 791.
A series of costs and benefits related to each model requires more detailed explanation. Labor costs for the different models are as follows:
Model 1: Cooking, Lighting and Pumping
1 skilled laborer/supervisor = (Rs 7.50/day) X (363 days) = Rs 2,737.50
3 unskilled laborers = (Rs 5/day) X (3 persons) X (365 days) = +5,475.00
Total labor costs = Rs 8,212.50
Model 2: Cooking, Lighting, Pumping and Ball Mill Operation and
Model 3: Lighting, Pumping and Ball Mill Operation
Same as Model 1 = Rs 8,212.50 Plus the cost of 1 supervisor at (Rs 300/month) X (12 months) = 3,600.00 Total = Rs 11,812.50
These labor costs are reflected in the cash flow calculations. However, in the village benefit calculations, it is assumed for purposes of simplicity and lack of actual data that wages paid to operate the system will be spent within the village itself. Therefore, labor "costs" to the village are cancelled by an equal amount of village "benefits" that would accrue from those wages being spent on village goods and services. This clearly is a gross oversimplification of complex capital flows. However, given the orders of magnitude involved, this approach will suffice for our purposes.
Operation and maintenance costs for each model are shown in Table VI-5.
Table VI-5 Annual Operation and Maintenance Costs
Model 1, Model 2, and Model 3
Digester Maintenance 250.00 250.00 250.00
Diesel Fuel (a) for running pumpset 79.75 79.75 79.75 generator 724.95 724.95 724.95
Ball Mill
Lubrication Oil (b) for running pumpset 47.25 47.25 47.25 generator 429.60 429.60 429.60
Ball mill
240.00 240.00
Raw Material Purchase (c) -- 4,800.00 4,800.00
(a) A 5 hp dual fuel engine requires .05 liters of diesel fuel/BHP/hour. At Rs 2.70/liter, a 5 hp engine costs Rs 0.675/hr to operate. Diesel fuel consumption figures are derived by: Pumping: (20 minutes/day) X (358 days) X (Rs 675) = 79.75 Generator: (3 hours/day) X (358 days) X (Rs 675) = 724.95 Ball Mill: (2 hours/day) X (300 days) X (Rs 675) = 405.00
(b) Similarly, lubrication costs for a 5 hp engine/hr are: (.008 liters of lube oil/BHP/hr) X (Rs 10/liter of oil) X (5 hp) = Rs .40. This cost is multiplied by the same running times as shown above.
(c) 24,000 kg of lime will be purchased from a nearby village at Rs 0.20/kg, and will be mixed with the ground rice husks to produce cement.
Finally, we will assume that the surplus gas generated in the maximum output scenario could be sold at the equivalent diesel or electricity price, and that demand will keep pace with supply. This represents a potentially large source of revenue to the system. The conversion factors for the equivalent prices of diesel and electricity can be calculated as follows:
Surplus gas sold as diesel. The value of surplus gas sold as diesel equals the difference between the cost of running an engine on biogas and the cost of running it on diesel fuel, as is shown in Table VI-6.
Table VI-6 Fuel Costs of Generating 1 BHP with a Diesel and a Dual Fuel Engine
Standard Dual fuel Diesel engine biogas engine
Diesel fuel (.25 liters/BHP/hr) (.05 liters/BHP/hr) consumed X Rs 2.70 = Rs .68 X Rs 2.70 = Rs .14
Lubricating (.015 liters/BHP/hr) (.008 liters/BHP/hr) oil consumed X Rs 10 = Rs .15 X Rs 10 = Rs .08
Combined cost of diesel Combined cost of diesel Total fuel and lubricating fuel and lubricating oil = Rs .83 oil = Rs .22
The total difference in the combined cost of diesel fuel and lubricating oil for a standard diesel engine and for a dual fuel biogas engine is Rs 0.83 - Rs 0.22 = Rs 0.61/BHP/hr. A dual fuel biogas engine thus saves Rs 0.61 in fuel and lubricating oil costs for each hour it operates.
We know that 0.42 [m.sup.3] of biogas are needed to generate one BHP/hr. We can use the following formula to calculate the Equivalent Diesel Price/m.sup.3:
(0.42 [m.sup.3] biogas/BHP/hr) X (EDP/[m.sup.3]) = Rs 0.61.
EDP/[m.sup.3] = Rs 0.61 = Rs 1.48/[m.sup.3] Rs 0.42/[m.sup.3]
This shows that biogas is competitive with diesel fuel when it can be sold at a price no greater than Rs 1.48/[m.sup.3]. This calculation uses current prices and assumes that a dual fuel engine will reduce by half the amount of lubricating oil consumed.
Surplus gas sold as electricity. The value of surplus gas sold as electricity is calculated by equating the cost of running a diesel generator with biogas with the cost of purchasing a kwh from the central grid. We know that 1 BHP = .74 kwh, the running cost of operating a diesel engine to produce 1 BHP-hr = Rs .22 (from above), and the local cost of electricity is Rs .44/kwh. Therefore, the equivalent electricity price (EEP) = (.42 [m.sup.3]/BHP/hr) x (EEP/[m.sup.3]) + Rs 0.22 = (.74 kwh/BHP) x (Rs .44) = Rs .25.
The analysis of an energy or development project is only as good as the quality of its assumptions. Many studies bury these assumptions in obscure appendices. Conclusions and generalizations made in the body of such studies are rarely subjected to a critical eye; instead, they are taken by the reader as given. This study includes the detailed intermediate calculations for the models to facilitate the reader's understanding and criticism of the simulations. Some of the notations--such as the use of the underline (_) sign--are awkward. They are written in this way to correspond in appearance to the computer printouts in the Appendix, which describe the detailed baseline simulation for all of the models. Readers not interested in the mathematical derivation of the NPV and payback calculations may skip to pages 61-62 and skim the left-hand column for a sense of the key benefits and costs. Conclusions from the analysis begin on page 75.
Table VI-7 shows the notation, including all constant values, that is used through the analysis to describe all system variables for the three models under each scenario.
Table VI-7 Analysis to Describe All System Variables
D = Total biomass yield per annum, corrected for handling losses and system down-time as a function of the Minimized Cost or Maximized Output scenario.
D_L = Diesel required for running a generator set (genset) per annum: (.05 liters/hr/BHP) X (3 hrs) X (5 hp) (358 days) = 268.5 liters.
D_LC = Cost of the digester, gas holder, and solar water heater, as a function of system capacity.
D_P
Diesel required for pump operation per annum: (.05 liters/hr/BHP) X (5 hp) X (20 min/day) X (358 days) = 29.5 liters.
D_RC = Diesel required for running the ball mill used to produce rice cement: (.05 liters/hr/BHP) X (5 hp) X (2 hrs X (300 days) = 150 liters.
E = Cost of all accessories, connections, electrical wiring, shelters, pumpsets, genset gas burners, and miscellaneous equipment, as a function of tasks to be performed in the three Models.
G = The gas yield of .0475 [m.sup.3]/kg fresh biomass.
G_C = Gas required for cooking per annum. Calculated earlier as approximately 11,425 [m.sup.3].
G_L = Gas required for electric lighting per annum = 2,255 [m.sup.3] biogas (previously calculated).
G_P = Gas required for pumping water = 251 [m.sup.3] (previously calculated).
G_RC = Gas required for operating the ball mill that is used in the production of rice husk cement per year: 1,260 [m.sup.3] biogas (previously calculated).
IA = Marginal increase in agricultural income due to nutrient and humus content of biogas slurry as a function of total quantity of organic material digested, in rupees/annum. Though the actual value of IA will fluctuate due to changing crop yields and market prices, IA is treated as a constant for the sake of simplicity.
L = Labor costs at a function of the different models, in rupees/year.
LO_P = Lubricating oil for pumping per annum: (.008 liters/BHP/hr) X (5 hp) X (20 min/day) X (358 days) = 4.7 liters.
LO_L = Lubricating oil for lighting per annum: (.008 liters/BHP/hr) X (3 hrs) X (5 hp) X (358 days) = 43 liters.
LO_RC = Lubricating oil for lighting per annum: (.008 liters/BHP/hr) X (2 hrs) X (5 hp) X (300 days) = 24 liters.
LO = Total annual cost of lubricating oil: LO P + LO L + LO RC.
M = Material cost (lime) for manufacturing rice husk cement, in rupees/year.
N = The economic life of the system: 15 years.
N_LC = Period in which the loan will be amortized: five years. P = Cost of distribution pipeline to supply cooking gas: Rs 10,000.
P_D = Unit price of diesel fuel at Rs 2.70/liter.
P-DS = Unit price of surplus energy sold as diesel at Rs 148/[m.sup.3] or Rs .74/[m.sup.3].
P-ES = Unit price of surplus energy sold as electricity at Rs .44/kwh, the current rate in Karnataka, at Rs .2.5/[m.sup.3].
P-FW = Unit price of firewood at Rs .04/kg.
P-K = Unit prices of kerosene at Rs 2.25/liter.
P-LO Unit price of lubricating oil at Rs 10.00/liter.
R = Revenue from commercial operations--the annual sales of rice husk cement. The Pura village operation hopes to produce 80 tonnes of rice husk cement per year. This will be sold at Rs 400/tonne, or a total of Rs 32,000. For the purposes of analysis, the effects of four levels of annual sales--Rs 0, Rs 10,000, Rs 20,000, and Rs 30,000--have been calculated. To simplify the analysis, revenue is held constant over time. In actuality, it would fluctuate with demand.
R-LC = Interest rate of loan, calculated at both 4 percent and 10 percent.
The following equations have been used for certain intermediate calculations:
1. Annual Recurring Cost Calculations
Capital Cost of System (K) = (D___LC) + P + E + the Amortization Coefficient (a function of N_LC) and (R_LC), as explained previously).
Cost of Diesel for Operat- = (P__D) X [(D__P) + (D__L) + ing the System (DF) D_RC)].
Cost of Lubricating Oil = (P__L) X [(LO__L) + (LO__P) + for Operating System (LO) (LO_RC)].
Cost of Operation and = L + M + Rs 250 (miscellaneous Maintenance annual maintenance).
2. Annual Benefit Calculations
Energy saved from Reduced = (P K) X 1,983 liters of Kerosene Consumption kerosene saved annually
Energy saved from Reduced = (150,000 kg) X (.04 ) X (P_FW), Firewood Consumption as explained previously.
Total Gas Produced Annu- = D X G. ally (G-T)
Surplus Gas Available = (G T) - [(G C) + (G L) + (G P) + Annually (G S) (G_RC)].
Sale of Surplus Gas Con- = (G_S) X (P DS) X (0.9). The verted to Diesel (0.9) is a utilization factor, since not all energy produced would be used.
Sale of Surplus Gas Con- = (G_S) X (P__DS) X (0. 9), as verted to Electricity explained above.
3. Net Benefits--Costs to
[Expenditures Saved From Reduced village Consumption of Kerosene and Firewood + IA + (Sales of Surplus Energy at either Diesel or Electricity Equivalent Price) + R] - [Annual Capital Cost + Diesel Cost + LO + M + Rs 250]. Labor costs are excluded from this calculation as explained earlier. The Rs 250 is for routine maintenance.
Finally, although all costs are calculated on the basis of the system operating at full capacity, we will assume that there will be periodic maintenance delays, and that the system will not supply gas every day each year. This will affect the amount of surplus gas available, and will reduce the benefits realized from fuel savings of firewood, kerosene, etc. The daily amount of biomass still will be fed into the system, so the IA will remain unaffected. Since the rice husk cement operation runs only 300 days a year, the seven-day maintenance is assumed to occur during the 65-day slack period. To correct the calculations for the system's "down time," energy saved from reduced kerosene and firewood consumption, and sale of surplus gas are multiplied by one week divided by 52 weeks = 0.981. Discussion of Modeling Results
We are interested primarily in whether or not the biogas systems described earlier enable the village to be "better off." This is measured by the positive NPV, as explained earlier. We also are studying whether the systems generate sufficient revenues to cover their operating and capital costs, as measured by the undiscounted payback period. The computer program developed for this analysis was designed to enable the user to modify any of the 27 variables to isolate and examine their effect on economic performance. For the purposes of this analysis, two main types of variables were examined.
1. The interest rate of the loan (R_LC) was examined at 4 percent and 10 percent for all models.
2. The system revenues for the models, the sale of surplus gas (P_DS) , and the revenues from the sale of rice husk cement (R) were set at various levels. Revenue from the sale of gas, available only in the maximum output scenarios for all models, was examined at zero, as well as at the equivalent price of: diesel fuel (Rs 1.48/[m.sup.3]), one-half the equivalent price of diesel fuel (Rs .74/[m.sup.3]), and the equivalent price of electricity (Rs .25/[m.sup.3] Revenue from the sale of rice husk cement was set in Models 2 and 3 at zero, Rs 10,000, 20,000, and 30,000. Model 1 has no provisions for running an industry.
In addition, the impact of a hypothetical technological break-through that somehow reduces the cost of the digesters by 50 percent (1/2 D_LC) was examined. In this simulation, interest rates and revenues from the sale of rice husk cement vary, as explained earlier, and revenues from the sale of surplus gas are set at zero and the diesel equivalent.
The results from these combinations of different interest rates, sales of surplus gas, sales of rice husk cement, and digester costs are shown in the summary Tables VI-10a through VI-10d.
Before discussing the results of this analysis in detail, it must be remembered that all the figures are rough and indicative only of orders of magnitude. For example, in evaluating the NPV figures, it is most important to note whether or not the values are positive and "large," such as more than Rs 10,000. This enables us to state with reasonable confidence whether a particular biogas system would provide a village with a net gain.
Payback figures need to be viewed more exactly. As the data will show, differences in the loan repayment schedule, amortized over five years with a one-year grace period, dramatically affect the ability of systems to pay for themselves. Any system that does not repay the loan in the first year, in addition to covering its operating costs, will require working capital from a source that is external to the biogas system. Even though the system pays for itself in the long run, the cash flow generated from its operation may be insufficient to meet short-term debt servicing, especially through the sixth year of the project. Thus, if operations are to continue, the deficit must be offset by an external source of funds. This might include user charges or subsidies, as will be discussed later.
In this analysis, the economic life of system components is held constant at 15 years for all calculations. The biggest source of error here could be a shorter life of the diesel engine. But with proper maintenance and the reduced deterioration observed in laboratory engines run on biogas, an equipment life of 15 years seems reasonable. Of the 144 cases examined, there were seven in which the payback occurred only in the ninth year or later. In those seven cases, a 10-year economic life for system components would mean that the project would not be financially viable.
The basic challenge to any village embarking on a large-scale biogas project, of course, is to cover the running capital costs of the system. Tables VI-8 and VI-9 below show these costs in some detail. The figures in these tables are taken from the detailed baseline benefit-costs calculations found in the photocopied computer printouts in the Appendix.
Interest rates will be discussed in greater depth shortly. However, if the capital for the system were borrowed at the higher rate of 10 percent, the annual cash flow during the repayment of the loan would be only 8-10 percent higher than if the money were obtained at the preferred rate for associations of 4 percent (as shown in Table VI-8). In view of the sum of money involved, the interest is not of great importance.
Table VI-8 Baseline Data: Annual Operating Deficit (in Rupees) for Models 1-3 (Full Cost Digesters)
MODEL 1
Years Min. Cost Max. Output 1, 7-15 8,993 8,993 2-6 at 4 percent interest 21,718 23,672 at 10 percent interest 23,936 26,231
MODEL 2
Years[\N Min. Cost Max. Output 1, 7-15 18,038 18,038 2-6 at 4 percent interest 32,863 34,458 at 10 percent interest 35,448 37,320
MODEL 3
Years Min. Cost Max. Output 1, 7-15 18,038 18.038 2-6 at 4 percent interest 28,258 32,211 at 10 percent interest 30,040 34,683
Similarly, as shown in Table VI-9, if the costs of the digester are cut in half due to a technological breakthrough, the annual cash deficits during repayment of the loan range from only 2-11 percent less than those obtained with the digester at "full" cost. Since the other fixed costs of the systems are so large, savings resulting from reducing the digester costs are surprisingly trivial when spread over the five-year loan repayment period.
None of the systems pay for themselves as a result of cash savings derived directly from operations. Savings "derived directly from operations" would include reduced fuel and fertilizer consumption expenditures and, technically, any multiplier effect stemming from the alternative use of saved capital. It would not include revenues from the sale of surplus gas, surplus slurry, or products or services provided by industries run on the gas. This distinction between savings and revenues is important because the savings will be far less likely to fluctuate than revenues, which are affected by market forces. Savings will accrue as long as demand, prices, and system performances do not decline. Of the three models examined, only model 1 (cooking gas, electric lighting, and village water pumping) yields a positive NPV from the direct savings accruing to the village over the system's 15 operating years (see Table VI-8). The size of the NPV increases slightly for the systems with digesters at half cost. Only in the case of the Model 3 maximum output system (with capital borrowed at 4 percent) does a negative NPV become positive. Yet even here, the NPV is an insignificant Rs 1,497. Even with no direct revenue from operations, 11-he Model 1 village gains economically from constructing the system. Of course, it may be somewhat unfair to criticize a village system designed to run a small industry when the projected revenue from the industry is arbitrarily set at zero. However, the critical importance of that revenue is underscored by doing so.
Table VI-9 Baseline Data: Annual Operating Deficit (in Rupees) for Models 1-3, with Digester Costs Reduced 50 Percent
MODEL 1
Years Min. Cost Max. Output 1, 7-15 8,893 8,893 2-6 at 4 percent interest 20,213 21,190 at 10 percent interest 22,169 23,316
MODEL 2
Years Min. Cost Max. Output[N] 1, 7-15 18,038 18,038 2-6 at 4 percent interest 31,178 31,976 at 10 percent interest 33,496 34,406
MODEL 3
Years Min. Cost Max. Output 1, 7-15 18,038 18,038 2-6 at 4 percent interest 27,753 29,729 at 10 percent interest 29,447 31,768
With all these cautionary notes, we now move to examine the economic performance of the biogas systems, using different levels of annual revenue obtained from either the sale of surplus gas or the sale of rice husk cement (or both). All data can be found in Tables VI-10a through VI-10d below.
Table VI-10a Net Present Value (NPV) and Payback Period at Different Interest Rates for the Three Models With No Revenue from Sales of Rice Husk Cement
Note: NPV in rupees is listed first. Calculations assume a 15-year life of the system. Payback period in years is in parentheses. If the system will not pay back over 15 years, (0) is listed.
MODEL TWO MODEL ONE COOKING, LIGHTING MODEL THREE INTEREST RATE BIOGAS COOKING & LIGHTING & INDUSTRY LIGHTING & INDUSTRY OF THE LOAN PRICE Min Cost Max Output Min Cost Max Output Min Cost Max Output (R_LC) (Rs/[m.sup.3) Model Model Model Model Model Model
4% 0.00 14,454 33,512 -30,274 -13,902 -44,577 -7,057 (0) (0) (0) (0) (0) (0)
4% 0.25 50,180 680 26,438 (0) (0) (0)
4% 0.74 82,849 29,261 92,087 (0) (0) (0)
4% 1.48 132,187 72,425 191,231 (0) (0) (9)
10% 0.00 6,809 24,692 -39,182 -23,768 -50,718 -15,573 (0) (0) (0) (0) (0) (0)
10% 0.25 41,360 -9,186 17,921 (0) (0) (0)
10% 0.74 74,029 19,395 83,571 (0) (0) (0)
10% 1.48 123,366 62,558 182,715 (0) (0) (11)
4% = Interest rate charged to associations. 10% = Higher interest rate. Rs 0/[m.sup.3] assume no revenues from the sale of biogas; Rs 0.25/[m.sup.3] = Equivalent price of electricity; Rs 0.74/[m.sup.3] = One-half Equivalent price of diesel fuel; Rs 1.48/[m.sup.3] = Equivalent price of diesel fuel.
Table VI-10b Net Present Value (NPV) and Payback Period at Different Interest Rates for the three Models With Revenues of Rs 10,000 from Sales of Rice Husk Cement
Note: NPV in rupees is listed first. Calculations assume a 15-year life of the system. Payback period in years is in parentheses. If the system will not pay back over 15 years, (0) is listed.
MODEL TWO MODEL ONE COOKING, LIGHTING MODEL THREE INTEREST RATE BIOGAS COOKING & LIGHTING & INDUSTRY LIGHTING & INDUSTRY OF THE LOAN PRICE Min Cost Max Output Min Cost Max Output Min Cost Max Output (R_LC) (Rs/[m.suup.3)
4% 0.00 45,788 62,159 31,485 69,004 (0) (0) (0) (0)
4% 0.25 76,741 102,499 (0) (0)
4% 0.74 105,322 168,149 (0) (15)
4% 1.48 148,486 267,293 (0) (1)
10% 0.00 36,880 52,293 25,344 60,488 (0) (0) (0) (0)
10% 0.25 66,875 93,983 (0) (0)
10% 0.74 95,456 159,632 (0) (0)
10% 1.48 138,620 258,776 (0) (1)
4% = Interest rate charged to associations. 10% = Higher interest rate. Rs 0/[m.sup.3] assumes no revenues from the sale of biogas; Rs 0. 25/[m.sup.3] = Equivalent price of electricity; Rs 0.74/[m.sup.3] = One-half Equivalent price of diesel fuel; Rs 1.48/[m.sup.3] = Equivalent price of diesel fuel. Table VI-10c Net Present Value (NPV) and Payback Period at Different Interest Rates for the Three Models With Revenues of Rs 20,000 from Sales of Rice Husk Cement
Note: NPV in rupees is listed first. Calculations assume a 15-year life of the system. Payback period in years is in parentheses. If the system will not pay back over 15 years, (0) is listed.
MODEL TWO MODEL ONE COOKING, LIGHTING MODEL THREE INTEREST RATE BIOGAS COOKING & LIGHTING & INDUSTRY LIGHTING & INDUSTRY OF THE LOAN PRICE Min Cost Max Output Min Cost Max Output Min Cost Max Output (R_LC) (Rs/[m.sup.3]) Model Model Model Model Model Model
4% 0.00 121,849 138,220 107,546 145,066 (0) (0) (0) (0)
4% 0.25 152,803 178,560 (0) (12)
4% 0.74 181,384 244,210 (11) (1)
4% 1.48 224,547 343,354 (7) (1)
10% 0.00 112,941 128,354 101,405 136,549 (0) (0) (0) (0)
10% 0.25 142,936 170,044 (0) (14)
10% 0.74 171,518 235,693 (13) (1)
10% 1.48 214,681 334,837 (8) (1)
4% = Interest rate charged to associations. 10% = Higher interest rate. Rs 0/[m.sup.3] assumes no revenues from the sale of biogas; Rs 0.25/[m.sup.3] = Equivalent price of electricity; Rs 0.74/[m.sup.3] = One-half Equivalent price of diesel fuel; Rs 1.48/[m.sup.3] = Equivalent price of diesel fuel.
Table VI-10d Net Present Value (NPV) and Payback Period at Different Interest Rates for the Three Models With Revenues of Rs 30,000 from Sales of Rice Husk Cement
Note: NPV in rupees is listed first. Calculations assume a 15-year life of the system. Payback period in years is in parentheses. If the system will not pay back over 15 years, (0) is listed.
MODEL TWO MODEL ONE COOKING, LIGHTING MODEL THREE INTEREST RATE BIOGAS COOKING & LIGHTING & INDUSTRY LIGHTING & INDUSTRY OF THE LOAN PRICE Min Cost Max Output Min Cost Max Output Min Cost Max Output (R_LC) (Rs/[m.sup.3]) Model Model Model Model Model Model
4% 0.00 197,910 214,281 183,607 221,127 (7) (7) (1) (1)
4% 0.25 228,864 254,621 (1) (1)
4% 0.74 257,445 320,271 (1) (1)
4% 1.48 300,608 419,415 (1) (1)
10% 0.00 189,002 204,415 177,466 212,610 (8) (9) (1) (7)
10% 0.25 218,998 246,105 (7) (1)
10% 0.74 247,579 311,754 (1) (1)
10% 1.48 290,742 410,899 (1) (1)
4% = Interest rate charged to associations. 10% = Higher interest rate. Rs 0/[m.sup.3] assumes no revenues from the sale of biogas; Rs 0.25/[m.sup.3] = Equivalent price of electricity; Rs 0.74/[m.sup.3] = One-half Equivalent price of diesel fuel; Rs 1.48/[m.sup.3] = Equivalent price of diesel fuel.
Table VI-11a Net Present Value (NPV) and Payback Period at Different Cement Revenue and Interest Rates With the Cost of the Digester Reduced by One-half
Note: NPV in rupees is listed first. Calculations assume a 15-year life of the system. Payback period in years is in parentheses. If the system will not pay back over 15 years, (0) is listed.
REVENUE MODEL TWO FROM INTEREST MODEL ONE COOKING, LIGHTING MODEL THREE CEMENT RATE OF BIOGAS COOKING & LIGHTING & INDUSTRY LIGHTING & INDUSTRY SALES THE LOAN PRICE Min Cost Max Output Min Cost Max Output Min Cost Max Output (Rs) (R_LC) (Rs/[m.sup.3]) Model Model Model Model Model Model
0 0.04 0.00 19,641 42,566 -24,468 -5,348 -42,835 1,497 (0) (0) (0) (0) (0) (0)
0 0.04 1.48 141,740 80,978 199,785 (0) (0) (8)
0 0.10 0.00 12,899 34,737 -32,364 -13,723 -48,672 -5,528 (0) (0) (0) (0) (0) (0)
0 0.10 1.48 133,411 72,603 192,760 (0) (0) (9)
10,000 0.04 0.00 51,593 70,713 33,226 77,558 (0) (0) (0) (0)
10,000 0.04 1.48 157,039 275,846 (0) (1)
10,000 0.10 0.00 43,697 62,338 27,389 70,533 (0) (0) (0) (0)
10,000 0.10 1.48 148,665 268,821 (0) (1)
4% = Interest rate charged to associations. 10% = Higher interest rate. Rs 0/[m.sup.3] assumes no revenues from the sale of biogas; Rs 0.25/[m.sup.3] = Equivalent price of electricity; Rs 0.74/[m.sup.3] = One-half Equivalent price of diesel fuel; Rs 1.48/[m.sup.3] = Equivalent price of diesel fuel.
Table VI-11b Net Present Value (NPV) and Payback Period at Different Cement Revenue and Interest Rates With the Cost of the Digester Reduced by One-half
Note: NPV in rupees is listed first. Calculations assume a 15-year life of the system. Payback period in years is in parentheses. If the system will not pay back over 15 years, (0) is listed.
REVENUE MODEL TWO FROM INTEREST MODEL ONE COOKING, LIGHTING MODEL THREE CEMENT RATE OF BIOGAS COOKING & LIGHTING & INDUSTRY LIGHTING & INDUSTRY SALES THE LOAN PRICE Min Cost Max Output Min Cost Max Output Min Cost Max Output (Rs) (R_LC) (Rs/[m.sup.3]) Model Model Model Model Model Model
20,000 0.04 0.00 127,654 146,774 109,288 153,619 (0) (0) (0) (0)
20,000 0.04 1.48 233,100 351,907 (1) (1)
20,000 0.10 0.00 119,759 138,339 103,450 146,594 (0) (0) (0) (0)
30,000 0.10 1.48 224,726 344,882 (7) (1)
30,000 0.04 0.00 213,715 222,835 185,349 229,680 (1) (1) (1) (1)
30,000 0.04 1.48 309,162 427,969 (1) (1)
30,000 0.10 0.00 195,820 214,460 179,511 222,655 (7) (7) (1) (1)
10,000 1.10 1.48 300,787 420,943 (1) (1)
4% = Interest rate charged to associations. 10% = Higher interest rate. Rs 0/[m.sup.3] assumes no revenues from the sale of biogas; Rs 0.25/[m.sup.3] = Equivalent price of electricity; Rs 0.74/[m.sup.3] = One-half Equivalent price of diesel fuel; Rs 1.48/[m.sup.3] = Equivalent price of diesel fuel.
Model 1 -Cooking and Lighting
As discussed earlier, Model 1 has a positive NPV in both the minimum cost and maximum output cases. The size of the NPV is larger in the maximum output case since surplus gas is sold for profit. Under the most optimistic conditions--with digester costs cut in half, the highest price obtained from gas sales (Rs 1.48, the diesel equivalent), and the 4 percent interest rate on borrowed capital--the NPV is Rs 140,740. Even so, as in all cases of Model 1, the system is unable to generate sufficient revenue to pay for its annual operating deficits. These deficits range from almost Rs 9,000 for years 1 and years 7-15, to Rs 20,200-26,200 during the loan repayment years, 2-6. The system therefore would require either a subsidy or user charge to finance construction and operation.
Model 2 - Cooking, Lighting, and Small Industry
In the minimum cost case, annual cash deficits range from Rs 18,000 for year 1 and years 7-15 to between Rs 31,200-Rs 35,500 in years 2-6 (see Tables VI-8 and VI-9). Without revenue from the sale of rice husk cement, the system has a negative NPV and cannot pay for itself. When annual sales are greater than Rs 10,000, the NPV becomes positive. But it is only after sales reach Rs 30,000 per year that the system pays for itself. The higher interest rate only slows payback by one year. However, the payback period is 7-8 years, which still necessitates an external cash source. The one exception to this is the combination of the half cost digester with a 4 percent loan, which pays for itself during the first year.
If the Model 2 system capacity is expanded to accommodate more biomass input (the maximum output case), then the baseline annual cash deficits (from Tables VI-8 and VI-9) range from Rs 18,000 in years 1 and years 7-15 to Rs 32,200-Rs 37,300 in years 2-6. NPVs are positive if surplus gas is sold at the price of diesel fuel, at half the price of diesel fuel, and, of course, if the digester cost is halved and surplus gas is sold as diesel fuel. If surplus gas is sold at the equivalent price of electricity and there are no cement sales revenues, the NPV is barely positive with a 4 percent loan. It becomes negative if the loan is 10 percent, but reverts back to positive if sales revenues are at least Rs 10,000. The maximum output case pays back in 7-8 years (depending on interest rates) if revenues are at least Rs 20,000 and if the surplus gas is sold at the diesel equivalent. It pays back in 11-13 years if the gas is sold at half the diesel equivalent. The system does not pay back if the gas is sold at the electricity equivalent price. The half-cost digester case pays back in the first year if revenue is at least Rs 20,000, if gas is sold at the diesel equivalent, and if the interest rate is 4 percent. It takes seven years if the rate is 10 percent. If revenue is Rs 30,000 and no surplus gas is sold, the situation is much like the minimum cost case. There is a payback of 7-9 years, or of 1-7 years if the digester costs are halved. If revenue is at least Rs 30,000, and if surplus gas is sold, the payback occurs during the first year. However, there is a seven-year payback when gas is sold at the electricity equivalent and the loan is made at 10 percent.
Model 3 - Lighting and Industry
Based on annual deficits of Rs 18,038 for years 1 and years 7-15, and of Rs 27,700-Rs 30,000 in years 2-6, the minimum cost systems have positive NPV if revenues from the sale of rice husk cement are at least Rs 10,000. They pay back in the first year if revenues are at least Rs 30,000. A system designed for the maximum output case, with either revenue of at least Rs 10,000 or surplus gas sales (at the electricity or diesel equivalent), shows a positive NPV when the baseline annual deficit is Rs 18,030 in years 1 and years 7-15, and Rs 29,700-Rs 34,600 in years 2-6.
Payback periods are more complicated. In the case of a full-price digester, selling surplus gas at the diesel equivalent without any revenue from cement sales results in a payback of 9-11 years, depending on the loan rate. Under similar conditions, reducing the digester cost by half improves the payback position only slightly to 8-9 years. Surplus gas sold at half the diesel, or electricity, equivalent does not enable the system to be viable financially. If no gas is sold, but cement sales are Rs 10,000, none of the systems pay back. With sales of Rs 10,000 and surplus gas sold at the diesel equivalent, payback occurs during the first year for both the full- and half-cost digester systems. With similar cement sales, but with surplus gas sold at half-diesel equivalent, payback occurs only in the fifteenth year with a 4 percent loan. It does not occur at all at 10 percent or when the gas is sold at the electricity equivalent. If no surplus gas is sold, the system does not pay back if revenue from cement sales are Rs 20,000. At the diesel equivalent, and with surplus gas sold in addition to a profit of Rs 20,000 on cement sales, a system with a full- or halfcost digester will pay back in the first year. The same is true with Rs 20,000 in cement sales, and the surplus gas sold at the half-diesel equivalent combination. On the other hand, when the same level of cement sale is combined with surplus gas sold at the electricity equivalent, it only yields a 12-14 year payback. If cement sales are Rs 30,000 and no surplus gas is sold, the system pays back in either the first or seventh year, depending on the interest rate. However, in the half-cost digester case, the same system pays back immediately, regardless of the interest rate. The system has a one year payback period if cement sales exceed Rs 30,000, and if surplus gas is sold at any of the three prices.
SOME CONCLUSIONS
Certain generalizations can be made from the summary data in Tables VI-10a through VI-10d:
1. Of the 144 different ways in which the three models of biogas systems might perform, the systems pay back during the life of the system in 55 cases (38 percent of the total). Of the cases in which payback occurred, 35 (25 percent) had payback within the first year of the project's existence. One-fourth of the cases examined seem extremely economical when they have an adequate cash flow. In addition, only 32 of the 144 cases (22 percent) showed a negative NPV. This suggests that the village will show a net gain from building one of these systems in almost 80 percent of the situations that were modeled. However, these optimistic findings presume a source of revenue from the sale of rice husk cement or surplus gas.
2. Half of the 144 cases were examined with a 4 percent interest rate for borrowed capital; the other half had a 10 percent rate. Thirty-two of the 72 cases analyzed at 4 percent interest paid back during the life of the project. Thirty-one cases paid back at 10 percent. The one remaining situation at 4 percent paid back only in the fifteenth year of the project. The remaining eight cases do not pay back at all. Interest rates for borrowed capital do not seem to affect the total number of projects that pay back. Twenty two cases pay back during the first year at 4 percent while 15 cases pay back during the first year at 10 percent. The lower interest rate increases by 10 percent the number of systems with an immediate payback. (Thirty percent of the 4 percent situations pay back within one year versus 20 percent for the higher interest cases). In most cases, the higher interest rate extended the payback period by only one to two years. Lower interest rates clearly improve the chances for a system to pay back immediately. But, the number of viable projects is relatively unaffected by interest rates. Viable projects are considered to be those with those with a means of covering the deficits occurring prior to payback, and which require no external source of cash during the years of loan repayment.
3. Of the three basic models examined, Model 1 (cooking, gas and electric lighting) does not pay back even when the sale of surplus gas and digester costs are cut in half. Model 2 (cooking, lighting, and small industry--rice husk cement production) payback occurs in 26 of the 64 possible cases. Of these, 10 cases (16 percent) pay back during the project's first year. In Model 3 (lighting, rice husk cement production), payback occurs in 37 of the 64 possible cases (58 percent). Of these, 27 cases (42 percent) pay back in the first year. Again, the data show the substantial impact of being able to sell surplus gas and rice husk cement.
All things being equal, it is more profitable to maintain a village system as a public utility and fertilizer plant than as a source of cooking gas. However, such an approach only is possible in a village in which:
a. An alternative energy source such as wood from carefully managed woodlots could be supplied at an affordable price to every household in the village. This is necessary since the system would take away people's only cooking fuel.
b. An alternative source of animal fodder could be found. This is necessary because the biogas system reduces the amount of village biomass available for fodder. This might be done by using some of the biogas slurry to grow algae or other sources of protein and roughage. However, both algae and roughage cultivation, as well as village woodlots, will require more project money, organization building, and technical support. These additional costs might be financed with the profits from a system with quick payback. Nonetheless, the opportunity costs of such resources cannot be ignored. Given the greater managerial complexity and increased resource demands of Model 3, in most cases it seems far more preferable to link a village system that supplies cooking gas with either a small industry or the sale of surplus gas. The concept of using a biogas system as an industrial energy unit deserves further study in view of the competitive unit energy costs derived from even a village-scale system.
4. Of the 36 cases pertaining to the minimum cost models, eight (22 percent) pay back within the life of the project and five (14 percent) pay back within the 15 year project life. Of these, 32 (30 percent) pay back in the first year. Resource opportunity costs, as well as the problem of estimating effective demand for surplus gas and rice husk cement, bear directly on these findings. If sufficient resources and demand exist, there does seem to be a greater chance of economic viability with the larger systems that can run an industry and provide additional energy. But it is essential that this question be examined in a particular village with its unique set of opportunities and constraints. 5. The minimum cost Models (both 2 and 3) that run an industry must realize income of at least Rs 30,000 during the period of loan repayment if they are to be viable, even if digester costs are halved (see Tables VI-8 and VI-9). Payback occurs in eight of 24 cases. Of these, five pay back in the first year. The case that comes closest to modeling the expected performance of the Pura system (full-cost digester, no sale of surplus gas) shows a payback of 7-9 years, depending on interest rates. This result is interesting because it does not assume that capital would be provided free of charge, as the Karnataka State Government is doing for Pura. Nonetheless, the project would need assistance during the loan repayment years to cover the operating deficit that would occur during that period.
6. In the 18 maximum output cases for each of the Models, surplus gas was set at different prices to examine the effect of those prices on economic performance. At the equivalent price of diesel (Rs 1.48/[m.sup.3]), 12 cases (67 percent) pay back during the life of the project. Eight of these (44 percent) pay back during the first year. Setting the price at one-half the diesel equivalent (Rs .74), nine cases (50 percent) pay back. Six of these (30 percent) pay back in the first year.
As one would expect, the lower price of the electricity equivalent (Rs .25/[m.sup.3]) yields only six cases that paid back (30 percent), and of these, only three paid back in the first year (17 percent). In each of the models, the price of surplus gas interacts with the different sales levels of rice husk cement. In 75 percent of these cases, payback occurs only if cement sales exceed Rs 20,000. Systems that sell gas at half the equivalent price of diesel fuel perform surprisingly well when compared to those that sell gas at the full diesel equivalent. Making energy available at half price might well attract certain small-scale industries to rural areas. However, quantities of surplus gas are limited since a village must use most of the available biogas to meet basic cooking, pumping, and lighting needs.
7. The effect of cutting digester costs in half was studied, assuming that surplus gas sold at the diesel equivalent in the maximum output system. Of the 54 cases examined, digesters at full cost paid back in 20 instances (40 percent of the total). Half-cost digesters also paid back in the same 20 situations. Full-cost digesters paid back during the first year in 11 of these cases (20 percent). Half-cost digesters paid back during the first year in 15 (28 percent) of these cases, a slight improvement over the more expensive design. This suggests that, based on the limited number of systems examined here, there may be only limited justification in devoting a great deal of effort towards reducing digester costs. The effect of cutting digester costs in a large-scale system is marginal unless the "fixed costs" of labor, diesel engines, generators, and the gas pipeline are also reduced. Even if one could assume that 56 individual family-scale plants could be built at Rs 500 each, and if labor were free, the costs of installing these plants to provide cooking gas and gas lighting easily would approach Rs 31,000. This is not much less than the Rs 43,000 proposed for Model 1. It also ignores the problems of providing an adequate supply of water for mixing with the biomass and resolving struggles over "dung rights" that might occur with family-size plants.
This analysis by no means exhausts all the possibilities of various system components. In particular, there are two possible sources of revenue that have not been included: user charges, and returning to the project a portion of income raised from increased agricultural yields. Due to the historical reluctance of many villagers to pay for cooking gas that substitutes for energy that was perceived as "free," it seemed sensible to first examine the conditions under which biogas systems might pay for themselves. Similarly, given the uncertainties surrounding the magnitude of increased agricultural productivity that would be attributed to a biogas system, the effects of returning to the project a portion of any marginal increase in agricultural income were excluded from our calculations. Still, one can speculate about the impact of including these potential sources of revenue.
From Table VI-8, we know that the annual operating deficit for the maximum output Model 1 system is Rs 8,993 in years 1 and 7-15, and Rs 23,672-Rs 26,231 in years 2-6, depending on the interest rate charged on borrowed capital. If Rs 4,000 of the Rs 8,100 expected increase in agricultural income were somehow returned to the project, the annual operating deficit would be cut to Rs 4,993 in years 1 and years 7-15 and to Rs 19,672-Rs 22,231 in years 2-6. If these deficits somehow were divided among the 56 families, the average cost per family would be approximately Rs 7.50 per month (Rs 90 per year) for years 1 and 7-15, which seems quite affordable. The average costs during the period of loan repayment still would be prohibitive (Rs 397 per year per family). This figure might be a justification for a government grant for the cost of system construction. Since we know that operating costs can be covered by the village, and the system can sell surplus gas at the diesel equivalent, the annual revenue would increase by (26.7 [m.sup.3]/day) X (358 days/yr) X (0.9 utilization factor) X (Rs 1.48/[m.sup.3] Diesel Equivalent Price), which equals Rs 12,730. If a little over Rs 5,000 of the increased agricultural revenue were returned to the project, the average user charge per family would be about Rs 100 per year during the period of loan repayment (years 2-6). At all other times, the system would show a profit. We have not discussed the willingness of villagers, especially larger land holders, to return a portion of their increased income to the project.
If nothing else, it should be obvious that the question of whether or not village-scale biogas systems are economic is one of considerable complexity. Under certain assumptions, the biogas systems analyzed here seem to perform well. These assumptions are related to two types of demand:
1. Rural Energy Demand. Would villagers be willing to pay user charges for gas used for cooking and lighting? Would small-scale industries purchase surplus gas if it were sold at prices competitive with diesel fuel and electricity?
2. Small-Scale Industries Demand. Which goods and services could be produced by small-scale industries that are powered by biogas? Could these goods and services be sold in sufficient quantitites to provide biogas systems with needed revenue?
We know very little about these questions, although the methodology exists for deriving some empirical answers. Increased knowledge of rural capital flows and distribution is desperately needed to determine both the priority that villagers ascribe to rural energy systems and the economic viability of these systems. This is only another way of stating the obvious, which is that rural energy problems cannot be separated from the problem of development within a larger political economy.
VII. Village Utilization
As shown in the previous section, the economics of a village-scale biogas system can be deceptively complex. Yet of all the various aspects of biogas systems, the least studied is perhaps the most important: how do such systems affect people's lives? The experience with biogas systems to date sheds little useful information on this question. The Chinese claim that they will have installed as many as 20 million biogas plants by the end of the early 1980's--depending on which of the various estimates one reads. Technical teams sponsored by the UN; the Intermediate Technology Development Group (ITDG), London; the International Development Research Center (IDRC), Ottawa; and others all have reported observing or hearing about "large" biogas systems. These usually are connected to an institution such as a dairy or school. There is no detailed study available that documents the existence and performance of an integrated Chinese biogas production and distribution system that is used by an entire community. In fact, the Chinese experience seems to be distinguished by a reliance on individual family ownership and maintenance of biogas systems, although the labor, biomass, and delivery of construction materials may be provided "free" by a communal production brigade.(79)
Even in China, there is little information available on the number of biogas plants actually working versus the total number installed, nor on the performance levels of the working systems. S.K. Subramanian, discussing the efforts of other Asian countries, says that while some nations report the installation of tens of thousands of systems, the systems are almost exclusively small-scale family plants.(80)
For many years prior to the watershed 1973 oil embargo, the KVIC served as an undaunted promoter of biogas systems in India. Progress since then has been slow but steady. At the close of the fifth Five-Year Plan in 1980, KVIC claimed to have installed 80,000 family-sized systems in India. There is no reliable data on how many of these plants are actually in operation. An estimate of 50-75 percent was made by several independent observers contacted during the preparation of this study. Despite the fact that the KVIC has trained more than 2,000 people to provide technical assistance throughout India as part of a youth self-employment project, biogas plant owners frequently complain about poor servicing and inadequate access to technical information. Some of the problems of drum and pipe corrosion, clogging and scum build-up, and low gas yield are undoubtedly due to faulty management, improper maintenance, and insufficient amounts of biomass fed into the digester. Yet, because so little effort has been mounted to popularize biogas systems, and because travel budgets for technical personnel are so meager, plant operators are rarely informed about solutions to technical problems.
The government subsidy program designed to stimulate the adoption of biogas systems is cumbersome and, to a certain extent, regressive. Plants with a capacity of more than 6 [m.sup.3] presently are ineligible for any direct subsidy since they are considered quite economical. The result is that wealthier farmers who own the three or more cattle currently necessary to operate a small system can receive a subsidy, whereas a village project that would benefit rich and poor alike is ineligible. Though the specific terms of the subsidy have varied over the last several years, the current program is based on a central government grant alloted to the state governments. State governments actually manage the program by determining the specific guidelines that will be followed. In general, 20-25 percent of the system installation cost is subsidized. Fifty percent of the cost generally is borrowed at 9-12 percent interest, payable over three to five years. The remainder is paid in cash by the user, although the relative size of the loan and down payment vary. Subsidies usually go directly to the bank to reduce the size of the loan or to act as collateral. Few state governments have authorized designs other than the expensive KVIC model as eligible for the subsidy. The government of Uttar Pradesh has approved the Janata system, but most other state governments are not aware of the fixed-dome design. Plants using night soil also are ineligible. Delays of one year in obtaining the subsidy are common. Many banks do not have a competent staff to manage the program. An informal sample of several banks in Madras revealed that even the chief agricultural loan officers knew very little about biogas systems and the subsidy program.
The Chinese and, to a lesser extent, the Nepalese biogas programs are managed by local or regional organizations that were established specifically to help coordinate funding for and provide technical assistance to biogas system construction and operation. The Chinese seem to have linked regional extension organizations with macro-level planning bodies so that sufficient capital and construction materials are generated to fulfill production targets. In addition, an extensive promotional campaign using radio broadcasts, permanent exhibitions, films, and posters is used to generate interest in biogas plants. Finally, the Chinese social structure seems to lend itself to the rapid diffusion of biogas technology. The traditions of waste recycling and collective effort are strong. The system of government eliminates the need to appeal to individual families if the communal leadership accepts an idea. An effective extension system, in which people are trained to construct and operate biogas plants and then help train others, generates technology dissemination by "chain reaction." At the same time, a decentralized research and development system appears to have encouraged a great deal of autonomous local innovation. Funds presumably were provided for local experimentation with different biogas system designs.(81) Other countries would do well to study the particulars of the Chinese experience to judge more accurately which aspects of China's biogas development program could be adapted to different socio-cultural settings.
The Biogas Corporation, a public/private sector company in Nepal, guarantees system performance for five years and does its own installation. The Agricultural Development Bank of Nepal provides loans at six percent.
In sharp contrast to both the Chinese and Nepalese programs, the Indian effort has been fragmented among the KVIC (which also is charged with promoting more than 20 other small-scale industries), the Ministries of Agriculture and Rural Reconstruction, State Khadi Gramodyog (village industry) Boards, banks, contractors and builders, state agricultural departments, and agro-industries corporations. It is remarkable perhaps that the Indian program has achieved even its modest success(82) despite the serious problems of inadequate technical assistance, cumbersome financing procedures, and overlapping or conflicting institutional jurisdictions.
The KVIC has proposed a program to reach the 12 million families who own sufficient (three to five) cattle to operate a family-size biogas system. The KVIC believes that regional mass production of prefabricated ferrocement digester/gasholder segments could significantly lower the costs of small-scale systems. Even assuming that individual families pay for installation and operation of their own systems so that the government does not have to subsidize biogas systems directly, and also assuming that the overhead costs (including subsidies, credit facilities, technical assistance, and staff requirements) to the government for a large-scale biogas manufacturing program are only Rs 100 per family, the total overhead costs of such a program could easily approach Rs 120 crores ($156 million).
Such a program raises a number of important questions regarding the equitable use of scarce capital and the effects of such a program on rural income distribution.
Dung is a source of both fuel and income for the poor who, in addition to using dung they are able to find for cooking and space heating, also sell dung to generate a meager income. If "free" dung becomes monetized, then the poor, who will not have access to family-scale systems, may be deprived of both income and fuel. It may be possible to lessen the cattle-ownership constraint by a combination of solar heated digesters and the use of biomass other than dung. However, the capital costs and land requirements of these systems would still be beyond the means of the vast majority of poor village families.
The KVIC scheme also raises the question of tradeoffs between centralized versus decentralized fabrication of biogas plants. It is possible that both rapid installation and quality control would be more easily accomplished if units could be mass-produced. The possibility does exist for production economies of scale. Yet, a more decentralized approach, in which individual villagers would become skilled in and develop a business from building and operating biogas systems, might generate far more employment, consume less steel and cement, and rely more on local materials that are renewable and have a low opportunity cost. Furthermore, it would be likely to foster greater rural self-reliance and innovation, reducing the potential for bureaucratic delays, corruption, and infrastructure obstructions that often plague large-scale, centrally directed projects. The challenge of a decentralized scheme is how to develop effective ways of providing technical assistance and financing for these systems. Some suggestions for such a program are contained in the conclusion of this study.
As biogas systems become more dependable and less expensive, the task of defining the appropriate role of the government in promoting them assumes greater importance. It is possible that a government-sponsored production effort might itself become an obstacle to the large-scale use of biogas systems.
The most immediate need in the development of biogas systems is to gain considerably more experience with actual village-scale systems. There have been several attempts to develop such systems in India. One of these in Kodumenja village, Karimnagar district, Andhra Pradesh, was sponsored by the Rural Electrification Corporation, Limited, and the Indian Council of Scientific and Industrial Research (CSIR). The system consists of a ring of 24 interconnected ferrocement floating-drum digesters, with a total capacity of 128 [m.sup.3]. It is designed to provide cooking gas and lighting for 60 families, and to operate five pumpsets. The system's capital costs are more than Rs 1.25 lakhs ($15,625). There have been many problems with the ferrocement domes cracking due to improper fabrication, and the defective domes have been replaced. As of May 1980, however, the system was operating at only half its capacity because the village was in the midst of a political feud. Half the population refused to contribute dung to support a system that would also benefit their rivals.
Another community-scale plant in the village of Fateh Singh-Ka-Purva, Bhagayanagar Block, near Ajitmal, Etawah District, Uttar Pradesh, was designed and installed by PRAD with a grant from UNICEF. The system required a capital investment of about Rs 1.65 lakhs ($20,625) for two plants of 35 [m.sup.3] and 45 [m.sup.3] respectively, a dual fuel 5 hp engine, a generator, gas distribution pipeline, cooking burners, electrical wiring, and miscellaneous equipment. The 80 [m.sup.3] system was to have provided cooking and lighting (electric) for 27 households (177 people) in addition to running pumpsets, a chaff cutter, and a thresher.
Fatah Singh-Ka-Purva is an unusual village in that the residents are relatively comfortable economically. Almost every household owns land, and income is distributed rather evenly. The villagers are of the same occupational caste (shepherds), and were enthusiastic about building the biogas system. The spatial layout of the village is such that all households are clustered around one or two areas, which simplifies gas distribution (see Figure VII-1).
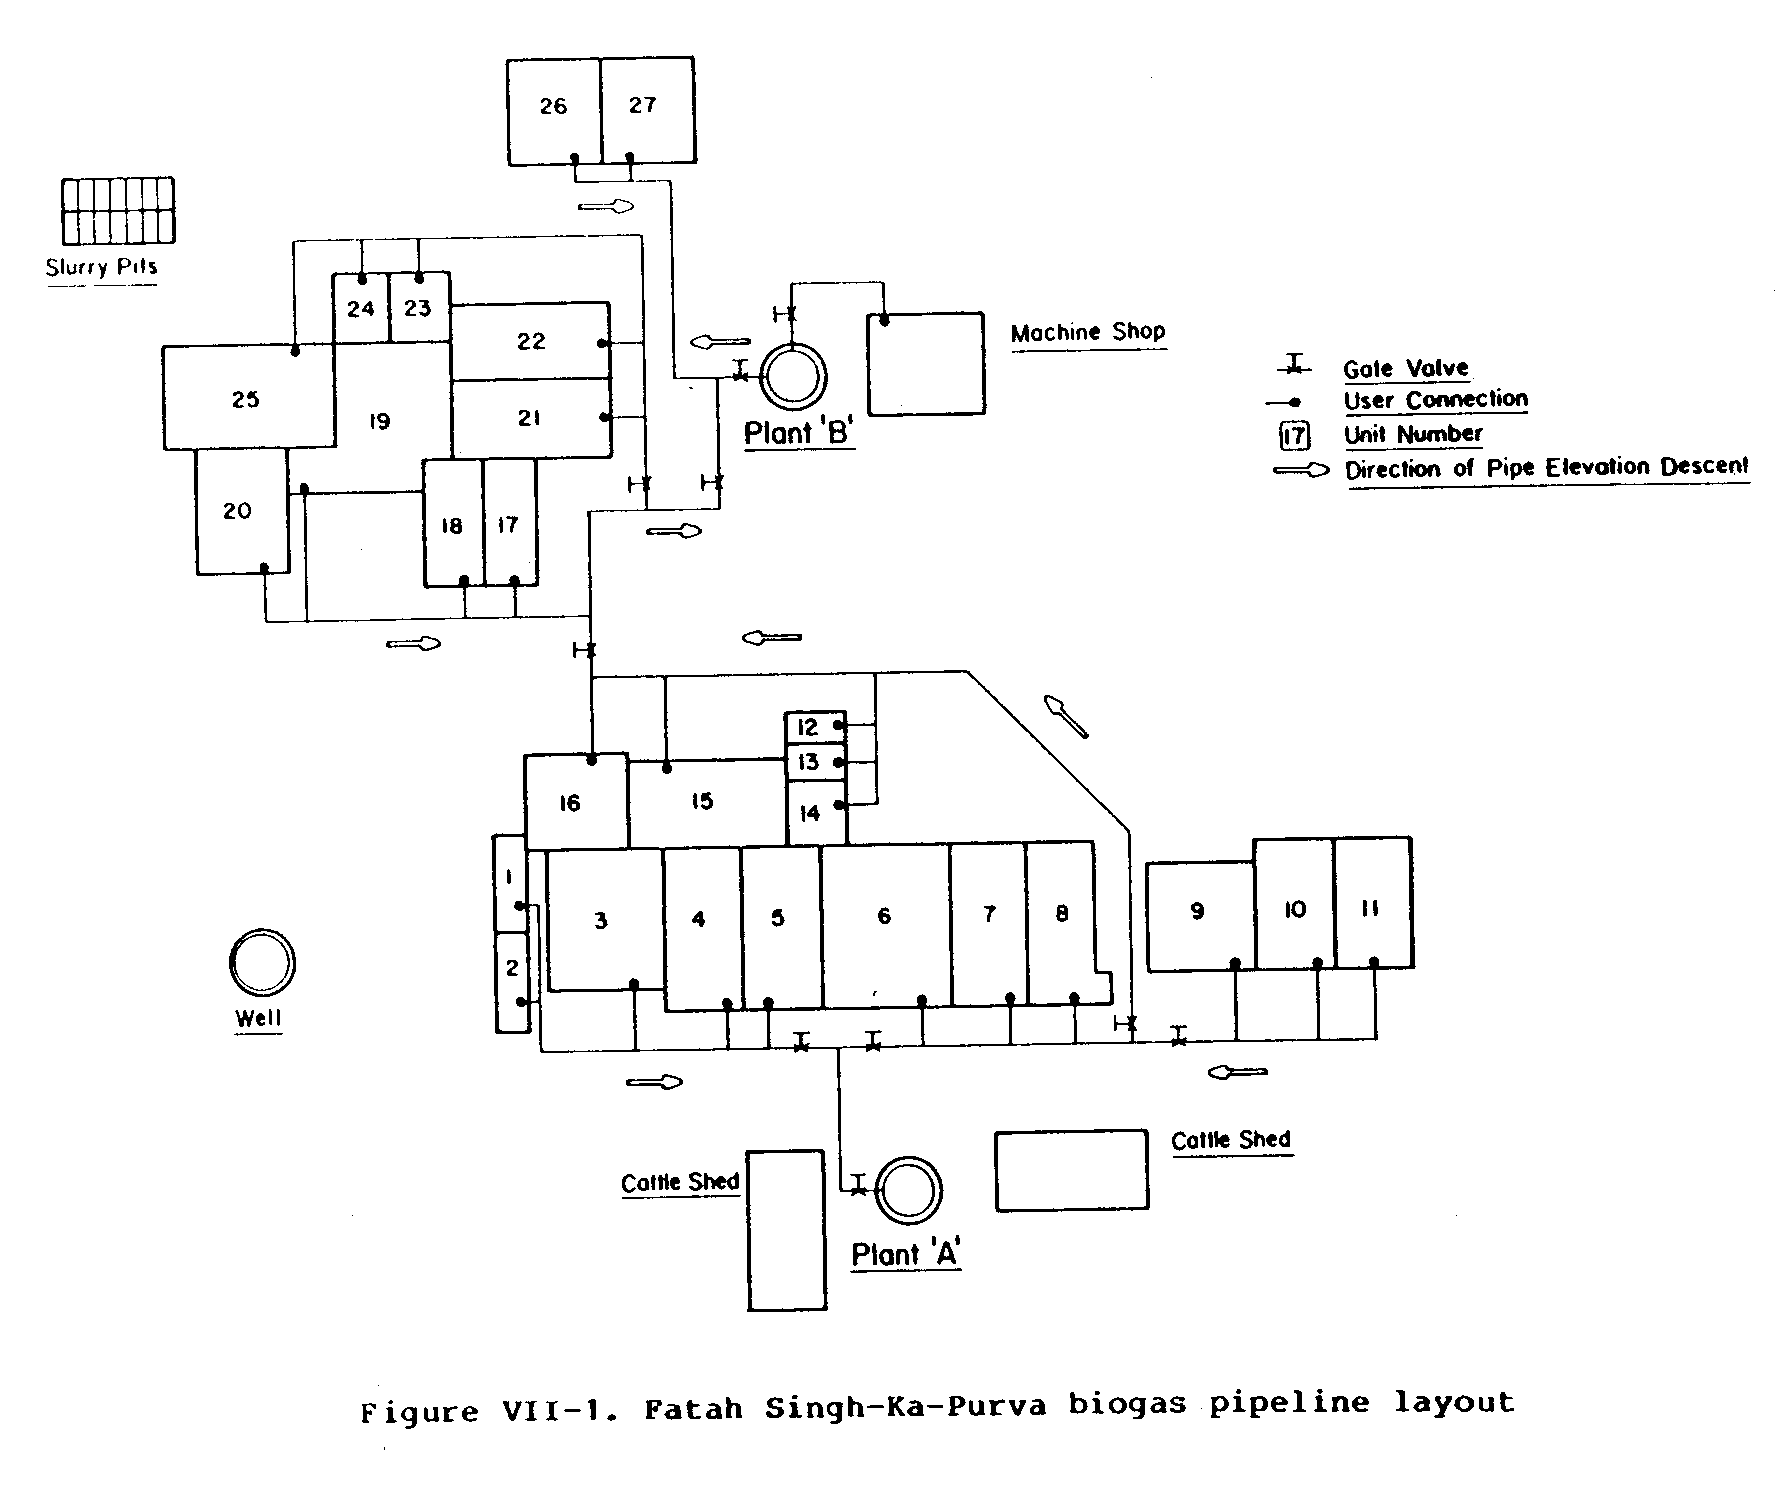
Finally, the village initially had an unusually high cattle to family ratio (4:1), compared to the national average of 2.5:1.
The advantages Fateh Singh-Ka-Purva enjoyed due to its socio-economic conditions, the technical competence of PRAD, the financial and organizational assistance of the local and state government authorities, and the good offices of UNICEF all were cast aside somewhat rudely by the unpredictable changes of nature. A serious drought resulted in the death or forced sale of a number of cattle, reducing the cattle population by almost 13 percent (from 117 to 97). This reduced the amount of dung available to the system. The system continues to struggle just to meet cooking and lighting needs. It will not be possible in the immediate future for the biogas system also to run machinery. During the author's visit, a substantial number of dung cakes were observed drying in the sun. Ironically, they were spread around the southern exposure of one of the digester bases. The residents of the village are not contributing the required amount of dung, perhaps 30 percent less than needed. Some villagers seem to prefer the taste of milk when it is slowly boiled over the more diffused heat of dung cakes. Similarly, the cooking of rotis, a kind of thin fritter, requires special burners to distribute heat over a broad surface area. People are sometimes inconvenienced by the fixed timings of gas release, restricted to two hours in the morning and two hours in the evening, especially if they have to work late in the fields. Some fuel is saved to heat water for bathing, washing, and cooking, especially during the winter months when gas production falls anyway due to the effect of lower temperature on microbial digestion. Finally, the author also observed some frustration on the part of the site engineer who, having left the project for two weeks, found certain tasks uncompleted or improperly executed. This seems to be related to village politics; some families do not support the president of the project "association."
Both these community systems distribute cooking gas freely. Slurry is distributed proportionately on the basis of per-household contribution. People are reluctant to pay for lighting, which is not perceived as a real need. Since cooking fuel formerly was "free," they are unwilling to pay for it now even though biogas is more convenient and cleaner. Villagers, while enthusiastic about the potential of the system, also have the political accumen to realize that these projects are really not theirs. They see that the systems are the showpieces of scientists and development agencies that cannot afford to let the projects fail. When a central government team visited Fateh Singh-Ka-Purva, villagers inquired what else could be "given" to them similar to the biogas plant. No mention was made of paying for additional services. The incentive to assume managerial and operational responsibility for these projects is simply lacking on the part of the villagers, and eventual self-sufficient management seems problematic.
Neither system is financially viable, in terms of cash flow, net present value calculations, or other economic performance measurements. In fairness to these projects, it must be remembered that they were pioneering efforts designed to demonstrate the technical feasibility of village-scale biogas systems. They also are intended to help technologists and planners understand some of the impact of this technology on village life. These goals were accomplished. While the analyses of economists are helpful in developing analytical methods and generating useful data on village household energy consumption patterns,(83) any criticism of these particular projects on economic grounds, even if only implied, seems somewhat unfair. By contrast, the ASTRA system under construction in Pura village is designed to be both profitable and self-sustaining. As such, it represents the next logical and necessary step in the development of village biogas systems.
Two of the largest village systems yet attempted in India, each with a daily capacity of about 200 [m.sup.3], are under construction in the Gujarati villages of Khoraj, Gandhigram District, and Khubthal, Ahmedabad District. These systems are based on the ASTRA-modified KVIC design, which includes the solar water heater. Designed and constructed, and to be managed, by the Gujarat AgroIndustries Corporation, both systems will supply more than 100 families in each village with gas for cooking. Biomass inputs will include dung, human wastes from a community latrine, and agricultural residues. According to the unpublished feasibility report, families will have to pay to connect their homes to the main gas pipeline. In addition, all dung will be purchased, slurry will be sold, and villagers will have to pay for the gas. Both systems require an investment of just over Rs 2 lakhs ($25,000) each. These systems will receive subsidies from the state government for approximately one-third of this investment cost. It will be interesting to monitor the progress of these projects, especially the willingness of the villagers to pay for gas, the performance of the systems and community latrines, and the long-term financial viability of the systems.
Technical Questions
Based on what we know about biogas systems, a number of problems must be resolved before a program can be disseminated on a large scale. Relatively little data exists on the net energy needed to prepare particular meals, nor on how this is affected by agro-climatic variations, income levels, and local customs. Such information is necessary to determine the required capacity of a biogas system in conjunction with whatever other operations are fueled by the biogas. More information is needed on the most efficient stove and burner designs, and on the effect of different types of cookware materials on gas use.
One of the few benefits of the inefficient and often smoky chulahs is that the smoke or odor aids in controlling mosquitoes and termites. Use of a clean burning fuel such as biogas might upset this balance. It may be that biogas systems can be introduced in certain local situations only in conjunction with different housing construction techniques or pest control measures.
Slurry handling and distribution can be both time consuming and annoying. Villagers express little interest in contributing free labor to biomass collection and slurry mixing, although in Fateh Singh-Ka-Purva they do assist in the delivery of slurry to individual compost piles, central storage pits, or crop lands. A large-scale community plant run on a continuous basis produces more slurry than can be used daily; convenient storage facilities must be provided. Alternative means of handling biogas slurry require further research within the context of village skills and capital constraints. These include possible mechanized distribution, direct application of manure versus "seeding" existing compost pits, or incorporation into integrated feed/fertilizer/fuel systems such as algae ponds, pisciculture, etc.
Water and land use requirements of biogas systems can be substantial. Large-scale underground plants can reduce land requirements unless plants are covered by a solar pond. Villagers will have to assess the opportunity cost of land occupied by a biogas system. Community biogas technical teams have in the past viewed the free donation of land and water for biogas systems as a kind of litmus test of a village's commitment to the system. This may not be an unreasonable approach, but it should not be assumed that land and water will always be available or close enough to points of use to prevent high distribution costs. In addition, ways to recycle the water and reduce the system's water demand, currently almost equal to the weight of biomass added, need to be developed. Finally, the spatial distribution of huts, sheds, wells, etc., in many villages may increase gas distribution costs dramatically. This is due to both the cost of the pipe and to the need to compensate for pressure losses over long distances. These distribution concerns, coupled with villager complaints about the inconvenience of fixed timings for the release of gas for both cooking and lighting,(84) suggest that alternative techniques for the decentralized storage of gas need to be investigated. Storage sacks with a compressible inner bag to maintain sufficient gas pressure could be developed. Safety problems--the danger of explosion due to puncture--and of practical storage volume need to be surmounted. The potential advantages of a more decentralized system have been discussed earlier.
Of course, these technical questions are in addition to numerous other areas requiring further research and development, as discussed in Section III. These include the use of agricultural and forest residues, the merits of fixed-dome versus floating-drum and plug-flow designs, the relative importance of constant gas pressure, and ways to increase gas production throughout the year.
Financial Viability
The most obvious economic challenge to community biogas systems is to make them viable financially. The economic analysis of the previous section shows that, given the reluctance of villagers to accept user charges, community biogas systems will have to find some other way to generate revenue or "cross-subsidization," even with significant cost reductions and improved system performance. Alternatives could be in the form of a "subsidiary" commercial operation or the direct sale of surplus gas to a small-scale industry. As was mentioned earlier, speculating on potential revenues is a far cry from actually generating rural industrial energy demand. In fact, it is unclear if the increased availability of inexpensive energy would be a sufficient stimulus to generate rural industries. Community biogas systems somehow must demonstrate that external revenue sources will materialize as expected. Whether or not lending institutions develop confidence in such assessments remains to be seen.
The difficulty in getting villagers to accept user charges will vary from village to village. Villages spending a significant proportion of the "village product" on energy will naturally be less resistant to some of the progressive pricing schemes suggested by Parikh and Parikh and by Moulik and Srivastava.(85) These authors suggest various pricing policies that combine higher unit prices for wealthier families, and either "free" (subsidized) community cooking and latrine facilities or the allocation of gas on the basis of free labor contributions by the poor.(86) These sensible pricing policies rely on a series of untested assumptions regarding the detailed keeping of records and monitoring of consumption that would be required to make such systems work. Furthermore, in many if not most villages, biogas is a substitute for what villagers perceive to be "free" fuels: dung, agricultural residues, or even firewood. Admittedly, such a perspective may seem somewhat shortsighted given deforestation, population growth pressures, and the high cost in time to a woman who has to walk for hours to gather fuel. But it is difficult for a villager to justify paying for something that can be obtained at the low cost of his, or more likely, her labor.
This outlook raises a much larger question concerning the perception of both villagers and economists regarding the utility of investing scarce capital in energy systems. Are village energy projects a response to clearly stated village demands, or are potable water, adequate shelter, an affordable supply of food, and a sufficient income to release a family from perpetual debt perceived as more important? The problem of "what is to be done" certainly will vary from village to village. It probably even varies from season to season. The village energy bandwagon should be jumped on first by villagers, and only then by economists and planners.
The overall effect of biogas systems on the local distribution of income is unknown. Bhatia and Nairam found that, as one would expect, energy consumption increases with income. Even in a relatively homogeneous village such as Fateh Singh-Ka-Purva, free cooking gas increases discretionary income the most for those with the most income.(87) Some potentially harmful effects already have been mentioned. Dung currently is sold by members of the lower castes to earn a meager income. A biogas system might take away that income source from them. Furthermore, an increased demand for dung or crop residues might deprive the poor of fuel. In addition, people who own more land and cattle clearly will benefit more from a proportionate distribution of biogas slurry. One could even speculate that, over time, increased agricultural productivity, energy, and income might make it possible for wealthier villagers to substitute capital for labor, gradually mechanizing their agricultural operations, and displacing some farm laborers.
While no one would deny the serious threats posed by deforestation, it is by no means clear that such ecological damage is always caused by the increasing rural demand for cooking fuel. While this undoubtedly may be an important cause in many specific areas, discussions with staff in the Ministry of Forestry revealed a great deal of uncertainty about whether it is the main one. For example, some large construction firms allegedly do not report the full number of trees they cut, harvesting more than they are allowed by permit.
Finally, there has been no attempt to assess the costs of providing the technical assistance, servicing, financing mechanisms, and performance monitoring that would have to be an integral part of any large-scale biogas promotion program. These overhead costs will occur regardless of whether a large-scale program creates the decentralized, "spontaneous" adoption advocated by many village technology groups, or the large, centrally coordinated, mass-production and installation programs favored by some in government and industry. The high costs of even unprofitable experimental village systems can only heighten apprehension on this point. The goal of research and development efforts must be to generate system designs that will minimize the dependence of villages on outside money, material, and technical assistance.
Sociological Questions
The paucity of sociological, anthropological, and organizational analyses, even of the two community systems discussed earlier, makes any treatment of such questions a matter of speculation.(88) Perhaps the most basic concern is the extent to which a real sense of community exists in villages where biogas systems are installed. It is clear that many villages are in fact "communities," i.e., they exhibit a shared sense of values and goals, have cooperative networks that enable the ebb and flow of daily events to occur reasonably peacefully, and enjoy a sense of trusted or accountable village leadership. However, many villages are less fortunate. Village life can be quite tempestuous, with an abundance of rivalries and struggles related to the rights of caste, marital or family discord, and indebtedness. For example, it remains to be seen if people of one caste will always be willing to consume gas distributed by the same pipeline that is used by lower castes.
There already is evidence that a serious political feud has effectively curtailed the operation of the village system in Kodumunja. To a lesser extent, factionalism also is operating in Fateh Singh-Ka-Purva. This form of protest or manipulation could seriously affect the cash flow position of a particular system, especially if loan payments are outstanding or if the biogas system is linked to one or more external commercial operations. If such a disruption, caused either by the withholding of organic raw material or by outright sabotage, continues for a long time, the long-term financial viability of the system and its dependent industries could be threatened. A related point is how rugged or durable biogas systems need to be to survive in the village, and how this affects costs.
An attitude of either cooperation or obstruction may prevail, depending on the relationship of different interest groups to the flow of benefits derived from the operation of the biogas system. A political minority might want to prevent those in power from receiving praise from villagers for successfully operating a biogas system. Such behavior has been observed in successful attempts to block the construction of irrigation canals that clearly would have benefited a village as a whole. The costs of potential loss of political power resulting from the construction of the canal were perceived by the victorious opposition as far greater than whatever gains would have been realized with the canal's operation. In addition, the detailed record keeping necessary for the technical and economical operation of the system would have conferred a great deal of power and responsibility on the plant supervisor. The range of potential abuse of such power has not been examined in this study since the dedicated efforts of the technical teams involved in the current village projects effectively preclude malevolence and corruption. However, such individuals may not always be present in many villages. The dependence of the villagers on the ethical conduct of the system manager creates the conditions for abuse. Some system of making supervisory personnel accountable to the villagers clearly is essential. This might be done through the Panchayat governments; however, even the record of these bodies in safeguarding the interests of the poor is mixed at best.
If villagers, especially women, spend a good portion of their day collecting fuel and cooking, a biogas system could create a fair amount of leisure time. It is not clear how this would be viewed and utilized by villagers. Many benefits of a biogas system will be most attractive to women: ease and cleanliness in cooking, freedom from smoky kitchens and associated eye and respiratory diseases, and freedom from tedious grinding, threshing, and chaffing operations that could be mechanized with the use of dual fuel engines. Will men agree that these benefits are desirable? It is unclear how much influence women enjoy over major investment decisions in the family. This could be an important consideration in promoting or marketing biogas systems.
The ability of villagers to accept the concepts of collective ownership and communal living will vary. Collective ownership of the land occupied by the biogas system, as well as of the system itself, cannot be taken for granted. Similarly, people may or may not respond positively to community kitchen and latrine facilities. Community latrines pose special complications. First, the flow of water from the latrines to the system somehow must be regulated so as not to result in excessive dilution of the biomass fed into the system. Second, the ritual of walking to the field early in the morning is one of the few times during the day when women find the privacy to socialize among themselves, free from other responsibilities. This may also be true for the time spent collecting firewood. It is not clear that these practices will be discontinued easily.
Finally, some people view biogas, and "appropriate technology" in general, as an agent of social change. They reason that because these technologies require a great deal of both stewardship and cooperative action on the part of users, the introduction of appropriate technologies will foster the necessary behavior and attitudes, even if these are outside the villagers' own experience. Such "technological determinism" may indeed exist, and there certainly are examples of it. However, the critical question remains: to what extent can a technology be "beyond" the present village culture and still be adopted by the villagers without causing undesirable socio-economic effects? Given that there is resistance to change, who will decide that "this" technology is in fact appropriate for "these" villagers, or that the social change required by a technology is desirable? Biogas systems affect some basic aspects of village life: the distribution of land, water, fertilizer, fuel, and income. It remains to be seen whether biogas systems can be adopted on a large scale without a political struggle to secure equitable access to these resources. These choices, if they are in fact choices, force us to confront the "appropriateness" of biogas systems. After much more experience with these systems, we might be in a position to evaluate biogas systems as a whole, voicing a collective approval or disapproval. But at this stage of development, such a pronouncement is unwise and potentially destructive.
The problem of actually introducing a technology, such as village-scale biogas systems, is one of staggering complexity. No one has analyzed fully how to transfer such a technology from the laboratory to the village as a necessary phase of research and development. It often is assumed that once technical problems are solved and biogas systems can pay for themselves on paper, villagers will accept biogas because it is a good idea whose time has come. For example, there is an extremely dedicated, private group of village energy specialists and biotechnologists who are working in a number of Tamil Nadu villages. This group has worked closely with a particular village for several years and still has a difficult time convincing certain families to experiment with small family-scale digesters. The families agree that biogas is a good thing, but are engaged in a highly profitable, but illegal, venture, producing arrak (a strong alcoholic beverage) and selling it in Madras. These families feel that their lives are progressing quite nicely and seem threatened by the presence of outsiders pushing biogas systems. Far too little attention has been devoted towards understanding under what conditions villagers will actually use biogas systems. How will they adapt to these systems without massive, unrealistic, and possibly undesirable intervention by government officials, engineers, technologists, or international lending agencies?
An extensive training program undertaken by a voluntary agency, Action for Food Production (AFPRO), New Delhi, to train masons to construct fixed-dome Janata design plants has been only partially successful. AFPRO has found that even though masons know what to do, they lack the self-confidence to construct these plants without supervision. AFPRO's experience suggests that training and extension work for promoting biogas systems (as well as for technology in general) must deal with psychological issues as well as with technical knowhow. If biogas systems cannot be designed, constructed, operated, and maintained largely by the people who will use them, their "appropriateness" in providing energy, fertilizers, and that messy thing called rural development seems dubious at best.
Nevertheless, it is important to acknowledge that despite the potentially serious managerial and sociological problems that may occur during the operations of village biogas systems, this does not mean such problems necessarily will occur. There are numerous examples of villagers adapting to radical departures from their traditional way of life once they were convinced of the merits of the new way. While vested interests will attempt to control any change, the judicious intervention by a village elder, popular chief minister, or perhaps even the prime minister, can immobilize obstructionist forces. Before such "marketing" is done, village-scale biogas systems must be economical and reliable, and their impact on different village groups better understood.
The point behind this discussion of questions still to be resolved is not to condemn biogas systems. Rather, it is to show that despite a great deal of promise, serious questions do remain. By specifying these uncertainties, a much clearer sense emerges of what is needed in the future. VIII. Conclusions and Recommendations
In 1974, Prasad, Prasad, and Reddy published "Biogas Plants: Prospects, Problems, and Tasks" in the Economic and Political Weekly. This highly influential article is a masterful synthesis of a great amount of seemingly unrelated data. It remains the most concise and comprehensive statement about biogas systems. In the years since, the ASTRA group, Bangalore, has conducted extensive research and development to improve system designs and increase gas yield through the use of solar energy. ASTRA has also begun to deepen our understanding of village resource and energy flows. PRAD, in Lucknow, has undertaken development and extension of small brick, fixed-dome digester designs with reasonable success. Other groups like MCRC, Madras, have experimented with low-cost hybrid digester designs and integrated energy-food-fertilizer systems. Two village-scale systems have been built and are functioning with mixed degrees of success, and at least three promising systems are under construction. The Department of Science and Technology of the Government of India has spent Rs 56 lakhs (roughly $700,000) on its three year, "All-India Coordinated Project on Biogas." This program sponsors research on the microbiology of digestion, ferrocement gas-holder construction, dual fuel engines, etc., and has established several regional biogas system testing centers. Other groups are also conducting experiments with biogas, as discussed earlier.
After numerous on-site visits and discussions, it seems that small, nongovernmental, often undercapitalized groups have contributed most to the further development of biogas systems. The government All-India Coordinated Project has not matched the autonomous small research groups in terms of the quality, creativity, and long-term usefulness of their research. The small teams are often constrained by lack of resources and insufficient "clout" to secure access to materials and monitoring equipment. Furthermore, their often tenuous financial situation makes it difficult for them to keep dedicated and competent research, development, and implementation teams intact. Such groups are especially difficult to maintain due to the system of rewards and incentives in Indian research. These incentives are either heavily biased toward Western basic research or else respond to the needs of Indian industry and government agencies.
Despite the achievements of some groups, it is clear that many of the basic questions posed in the 1974 biogas article in the Economic and Political Weekly still remain unanswered. System performance must improve; costs must be reduced, a variety of organic matter still awaits practical field level digestion, the relative advantages of fixed-dome vs. floating-drum gas-holders must be established, and the unknowns surrounding the operation and management of village-scale systems remain. Much more work needs to be done to piece together the data to answer these questions more definitively. In fairness, it must be noted that system construction, start-up, and operation must be evaluated for at least one year before any conclusions may be drawn concerning performance of a particular system. Even more time-consuming, and perhaps of greater necessity, is the difficult process of identifying a village that could use a biogas system to meet local needs. Promoters would then need to establish the trust and credibility to work there, collecting all relevant data, and finally designing and constructing a large-scale system. Biogas systems research also must compete with the full range of energy technology research, from solar collectors to breeder reactors.
Happily, the pace of biogas systems work is accelerating. The Pura village project will be quite helpful in assessing the potential contribution of biogas systems in meeting rural needs. The Pura system is based on detailed resource surveys and will be coupled with an industry. The system is an advanced design, and has village operation and self-management as a primary goal. PRAD is reportedly constructing several large 50-80 [m.sup.3] fixed-dome village-scale systems that should help answer some of the questions about both the cost and performance of the fixed-dome design. There are plans for constructing 6-20 village-scale systems as part of the Department of Science and Technology's further work in collaboration with KVIC, PRAD, the Center for Science for Villages, and the Indian Institute of Management, Ahmedabad.
While more village experience is needed, it is unclear whether the government sponsored approach will include the most cost-effective designs, integration of a small industry, and a genuine attempt to design and implement the systems with the equal participation of villagers. Even if the executing group plans to march into a number of villages and, in the space of several months, "drop" large-scale biogas systems in those villages and then monitor system operation, some technical data will be generated. However, these systems will be operating in the peculiar context of an "outside" project that villagers will treat with the same range of bemused, annoyed, bewildered, and manipulative attitudes that have been observed in similar projects. Such a scheme would be grandiose in scale, but limited in usefulness.
If the experiences of the dedicated research and extension groups such as ASTRA, PRAD, Center for Science for Villages, MCRC, Butwal Technical Institute, Appropriate Technology Development Association, and others are any guide, the nurturing of an equal relationship with villagers based on mutual learning and respect is a difficult, slow process that demands a complex mix of scientific, management, and communications skills, coupled with a great deal of commitment on the part of the technical assistance team. Effective village energy technology work and, probably, effective rural development are possible only if done at the micro-level.
Most of the remaining technical questions concerning biogas systems could be resolved easily within two to three years given adequate funding and proper coordination of research efforts. Some ways to do this, in order of increasing difficulty, are suggested below:
1. Create a network among the small biogas research groups so that their work becomes complementary and a greater exchange of experiences and knowledge occurs. The smaller groups understandably, and probably correctly, wish to preserve their autonomy. They are wary of any incorporation into a large government-sponsored research effort. However, these groups also suffer from an ignorance of each other's work due to poor communications, financial constraints precluding frequent contacts, and reluctance for a variety of reasons to take time away from their own work and share their findings with others.
This network must evolve from the groups themselves so that the autonomy of each remains unthreatened. Any external funding for this type of network, whether from private foundations, government ministries, or international lending agencies, must protect the autonomy of the participating groups. There may be some tension between the needs of the funding source to have accountability for its sponsored projects and the desire of some network participants to merely exchange information and not publish until their work is completed. This is not a question of jealously guarding trade secrets to protect potential profits or prestige. Many of these groups have had many painful experiences with outside interests that distort or exploit their years of work. The smaller groups often have special relationships with villages; outside interference can potentially undo years of establishing credibility and trust. Despite these challenges, the advantages of small groups sharing their work among themselves are numerous, and a framework for cooperation can be developed if the groups themselves are willing to do so.
2. Create a more harmonious relationship among national planners, national laboratories, and the smaller research and development groups. The exact nature of this relationship is difficult to specify, and a discussion of Indian institutional politics and bureaucratic jurisdictions is beyond the scope of this study. It would appear possible that smaller research and development groups could suggest areas of basic research in which they lack resources or competence. These areas could then be taken up by national laboratories and planning bodies.
There are several such research areas worth mentioning:
a. Analyses of the thermal efficiencies of different fuels as a function of the appliances in which the fuels are burned. The variations found in different agroclimatic regions must be identified so that reliable energy consumption norms can be established.
b. Surveys of energy flows in rural areas to establish a set of norms for different agroclimatic areas. It is essential to reduce the number of possible permutations due to customs, diet, geography, local costs, appliance efficiency, crop and animal husbandry patterns, etc., if rural energy planning is to move beyond macro-level guesswork and costly micro-level analyses.
c. Identification of small industries that can make use of the type of energy available from biogas systems. These industries must have a high probability of achieving a profit to enable a village system to be viable financially. Their various financial, technical, organizational, and marketing aspects need to be understood thoroughly. Some industries that seem to have promise are: dairies; refrigeration; use of Ca[CO.sub.2]-based products; grinding; milling; threshing; chaffing; food processing, rice husk cement manufacturing; brick and tile making; some melting operations; fertilizer manufacturing; animal feed and fodder; pyrolytic processes; and oil expelling and extraction.
3. Effective village energy planning will be possible only if an organizational infrastructure is created to deliver usable energy technologies to villages. Such an infrastructure must be able to undertake:
a. An assessment of needs, conducted jointly by villagers and planners. b. The development of responses to those needs which may or may not involve the installation of such hardware as a biogas system.
c. The implementation and monitoring of work.
These three phases of rural energy planning must be integrated, which clearly is a difficult management problem. This integration will require some creative organizational development. Many of the existing groups concerned with rural energy issues have considerable individual strengths, but are isolated from each other. They frequently approach energy planning in a fragmented way due to limited resources. The result is that technologists experiment in laboratories with technologies that are of questionable use to villagers, while many social scientists criticize the technologists' R&D efforts, often without understanding adequately the potential of the technology. Meanwhile, voluntary agencies often use unproven technologies whose many impacts are only dimly appreciated and for which sufficient financing and technical assistance resources do not exist. Invariably, these three groups--technologists, social scientists, and village voluntary agencies--engage in destructive rounds of recriminations. A way must be found to bring them together.
One way to nurture the kind of integration required would be to form state level rural energy groups. The state level seems an appropriate scale in terms of available resources, common language, politics, and existing institutions and programs. These groups would consist of representatives from private research teams, universities, state government officials, industry, lending institutions, and voluntary agencies. While some of these individual representatives might serve as advisers, there would also be a need for a full-time staff. The energy group would have the following functions:
1. Coordinate the state-wide rural research and development efforts of existing institutions, eliminating duplication and ensuring that research designs incorporate the perspectives of economists, anthropologists/sociologists, and voluntary agencies.
2. Organize the extensive exchange of rural energy information within the state, among other Indian states, and with other countries, especially throughout Asia. The considerable difficulties encountered by the author in obtaining reliable information for this study, necessitating repeated personal visits throughout India, underscores the need for information exchange.
3. Fund and evaluate demonstration projects, and, if necessary, create new research groups to do this.
4. Organize a "rural energy corps." The corps would consist of people trained in conducting energy/ecological surveys and would help villagers select technologies that seem appropriate to local needs. It would do this by helping people to obtain financing, secure access to materials, organize construction or training programs, and ensure the proper operation and maintenance of hardware. The corps would live in strategically chosen villages for several years to maximize the effect of demonstration projects, provide ongoing technical assistance, and monitor progress carefully. If corps members work with existing voluntary groups that already have established themselves in villages, so much the better. Where no such organizations exist, the corps could form the nucleus of a larger rural development effort that would be a natural outgrowth of "energy" work.
Aided by coordination from the rural energy group and the vast field experience of the rural energy corps, energy planning would become an important aspect of development planning. Energy planning cannot be separated from land use, ownership patterns, caste relations, the division of labor between men and women, access to credit, and the economic and political relationships between urban and rural areas. It is a dangerous delusion to treat rural energy planning as a matter of developing and installing "appropriate" hardware. A firm link between the multidisciplinary coordination of the energy group and the local planning and implementation work of the rural energy corps, each learning from the other, will help protect against such myopic planning.
If promising energy technologies, like biogas systems, are to contribute to rural life, the almost infinite number of system designs and variations must be reduced and simplified to a few basic systems. As Dr. A.K.N. Reddy suggests, this work must be based on a much deeper understanding of the village economy and ecosystem. It may be possible to classify villages broadly by the nature of their resource flows, and to use biogas system designs that would correspond to established patterns of consumption. At a minimum, a methodology must be developed to allow a technical team to assess easily, quickly, and accurately a village's resource flows. Such a methodology is vital for determining the best investments in energy and other technologies, and also for the broader development problem of the optimal use of local resources. The organization of state-level energy groups and a rural energy corps would be an important first step toward addressing some of these questions.
None of this work will be possible without the help and trust of villagers themselves. Efforts must be made to reduce the divisions of caste, religion, and education that have so crippled India. One way to begin building a cooperative village environment is to have a technical team work with a receptive village leadership to define simple projects that require collective work. These projects should be executed easily and have immediate and demonstrable results, such as improved village road drainage, construction of pit toilets, or a collective lift irrigation system. This would demonstrate the technical team's credibility and competence, and would provide the villagers with a sense of confidence and willingness to cooperate.(89) Using this experience as a foundation, more complex projects, such as a village biogas system, could be discussed to see if villagers felt this system made sense to them, given their perception of their needs. In this way, villagers could correctly feel that they chose a biogas system because it would make their lives easier, and thus would feel a sense of responsibility and ownership toward the system. They also would have confidence in the technical team and themselves, as proved by the successful completion of the earlier project.
As discussed earlier, a number of areas require more research and development work to improve the performance of biogas systems. However, far more effort is needed to link the laboratory with villagers. The shifting of emphasis toward joint research and development in partnership with villagers, responding to their sense of their needs, would be a radical departure from the current thrust of much rural energy research, which prefers the isolation of the laboratory and the cleanliness of the conference room. However romantic this approach may sound, it poses great challenges to scientists, planners, and villagers alike, even assuming that the will exists to embark upon this path. At the moment, it is difficult to be hopeful about the likelihood of such a commitment. There are numerous barriers that make this approach difficult. Even so, the barriers must be overcome. Women and children spend one-third to one-half of their waking hours collecting fuel. Crops are lost because there is no energy to run even installed pumpsets. Mountainsides are denuded and croplands destroyed. Entire generations of children cannot study in the evening because there is no light. While many of these conditions have existed for perhaps thousands of years, one can only wonder how much longer villagers will tolerate them, especially given the rising expectations caused by increasingly modern communications systems and political and commercial marketing.
During the preparation of this study, the author met literally hundreds of college students, government officials, university faculty, and industrialists who were at least convincingly sincere in their expressed desire to live and work with villages on rural energy problems. The often cited obstacle preventing these educated and committed individuals from doing so is the absence of an organization that would provide adequate technical and financial support, both for their work and their personal lives. There is a vast, potentially renewable energy source--human talent--that remains untapped in India. All that is needed is the vision to organize it. Notes
(1) China: Recycling of Organic Wastes in Agriculture (1978), FAO Soils Bulletins 40-41; China: Azolla Propagation and Small-Scale Biogas Technology (1979). Also see: M.N. Islam, "A Report on Biogas Programme in China" (1979).
(2) C.R. Prasad, K.K. Prasad, and A.K.N. Reddy, "Biogas Plants: Prospects and Problems and Tasks," in Economic and Political Weekly (1974). Bombay has had a large-scale municipal sewage gas plant in operation for some time, as have several other cities in India. R.K. Pachauri, Energy and Economic Development in India (1977) suggests that there is great promise for biogas systems in urban areas. There are reports from the People's Republic of China of municipal plants used to generate electricity. See Chen Ru-Chen et al., "A Biogas Power Station in Fashan: Energy from Night Soil" (1978).
(3) Roger Revelle, "Energy Use in Rural India," in Science (June 1976), p. 971.
(4) Ashok Desai, India's Energy Economy: Facts and Their Interpretation (1980), pp. 44-61.
(5) N.B. Prasad, et al., Report of the Working Group on Energy Policy (1979), p. 27.
(6) Revelle, op. cit., p. 970.
(7) A.K.N. Reddy et al., A Community Biogas Plant System for Pura Village (1979). Sheep and goat dung are not included in the calculations due to the difficulty in collection. The 8.0 kg/head average fits well with one set of detailed observations.
(8) Based on empirical observations, ibid.
(9) KVIC, "Gobar Gas: Why and How" (1977), p. 14. Reddy, ibid, p. 18, observes a higher calorific value biogas (5,340-6,230 kcal/[m.sup.3] but the conservative KVIC figures are used to account for variations in methane content due to temperature and cattle diet variation in India. Also, the calorific value for crop residues is slightly overstated. However, in view of the large amount of biomass, such as water hyacinth, that has been omitted from the calculations, this calorific value will suffice.
(10) S.S. Mahdi and R.V. Misra, "Energy Substitution in Rural Domestic Sector--Use of Cattle Dung as a Source of Fuel" (1979), pp. 3-11. No data are given for yield of goat dung; 0.1 kg/goat/day has been assumed and the calculation corrected accordingly.
(11) Revelle, op. cit., p. 973.
(12) Reddy, op. cit., p. 21. This figure, based on data collected in Pura Village, is a very crude measure of the percentage of total energy used in cooking. Little is known about the all-India range of variations of this figure, especially in the north where water heating and space heating requirements will vary seasonally. The figure probably overstates energy consumed in cooking. This is acceptable for our purpose since we are looking for conservative estimates.
(13) Ibid, p. 11.
(14) Fertilizer Association of India, Handbook of Fertilizer Usage (1980), p. 76. The calculations of the fertilizer content of organic materials are therefore conservative estimates.
(15) Madhi and Misra, op. cit., p. 5.
(16) The Hindu, 27, July 1980, p. 6, and discussions with the Fertilizer Association of India.
(17) N.B. Prasad et al., op. cit., pp. 14-16, 32.
(18) Ibid., pp. 16, 32.
(19) See Ashok Desai, op. cit. National Sample Survey Data and NCAER fuel consumption surveys are notorious for relying on interviews rather than actual measurement of fuel consumption. An all-India survey of energy consumption currently being prepared by NCAER attempts to improve data collection by establishing local norms for energy consumed in cooking, heating water, etc., and then interviewing people about their eating habits, daily routines, etc. From this data, energy consumption is computed based on the norms, rather than by asking people to "remember" or visualize how much firewood they collect daily. However, the latter information may be used to crosscheck survey data.
(20) One assumption that seems questionable is the rate of substitution of noncommercial fuels by commercial fuels. This is based on rapid progress in coal production and delivery, village electrification, greater availability of kerosene, increased hydrogeneration, conservation measures, greater use of nuclear power, and increased petroleum production to name a few. Recent power sector performance would suggest that such coordination and efficiency is not likely. Similarly, with population increasing to an estimated 920 million by the year 2000, it is hard to imagine noncommercial fuel consumption dropping as the Working Group suggests. Finally, the effects of increased agricultural production and the associated increased availability of crop residues and cattle population (and therefore dung) are not discussed in any detail.
(21) Ibid, pp. 35-36.
(22) Ibid, pp. 70-71.
(23) Ibid, pp. 37-39.
(24) These consumption figures are based on discussions with Kirloskar Oil Engines, Ltd. Experiments have shown that actual diesel consumption is reduced 90 percent. The 80 percent norm is used to account for performance fluctuations in engines of different ages, condition, etc.
(25) Reddy estimates for Pura Village that although a pumpset cost Rs 5,000, the electricity board can spend upwards of Rs 11,000 connecting the pumpset to the Central Government system. See Reddy, op. cit., p. 24.
(26) N.B. Prasad, et al., op. cit., p. 78.
(27) See National Academy of Sciences (USA), Methane Generation from Human, Animal, and Agricultural Wastes, (1977), pp. 66-69; C.R. Das and Sudhir D. Ghatnekar, "Replacement of Cow Dung by Fermentation of Aquatic and Terrestrial Plants for use as Fuel Fertilizer and Biogas Plant Feed" (1970); private communication with R.M. Dave, Jyoti Solar Energy Institute, Vallabh Vidyanagar; B.R. Guha et al., "Production of Fuel Gas and Compost Manure from Water Hyacinth and its Techno-Economical Aspects (sic) (1977); P. Rajasekaran et al., "Effects of Farm Waste on Microbiological Aspects of Biogas Generation" (1980); T.K. Ghose et al., "Increased Methane Production in Biogas" (1979); P.V.R. Subrahmanyam, "Digestion of Night Soil and Aspects of Public Health" (1977); N. Sriramulu and B.N. Bhargava, "Biogas from Water Hyacinth" (1980); FAO, China: Azolla Propagation and Small-Scale Biogas Technology (1978); N. Islam, "A Report on Biogas Programme of China" (sic) (1979), and Barnett et al., Biogas Technology in the Third World (1978).
(28) Personal correspondence with R.M. Dave, op. cit.
(29) K.V. Gopalakrishnan and B.S. Murthy, "The Potentiality of Water Hyacinth for Decentralized Power Generation in Developing Countries," (sic) in Regional Journal of Energy, Heat, and Mass Transfer, vol. 1, no. 4. (1979), pp. 349-357.
(30) C.R. Das and S. Gatnekar, op. cit.
(31) Islam and FAO, op. cit.
(32) National Academy of Sciences, op. cit.
(33) Islam, op. cit.
(34) Sources of information on the microbiological and engineering aspects of digestion include sources previously cited (c.f. 30) as well as FAO, China: Recycling of Organic Wastes in Agriculture (1978); John L. Fry; Practical Building of Methane Power Plants for Rural Energy Independence (1974); John Finlay, "Efficient, Reliable Cattle Dung Gas Plants: Up-to-date Development in Nepal" (1978); and the United Nations University, Bioconversion of Organic Residues for Rural Communities (1979). The information contained in the text has been obtained from the above sources and is a representative compilation of observed results from both laboratory and field tests. It cannot be overemphasized that the figures cited will vary depending on local conditions. Any project team referring to this study or the references cited would be wise to analyze thoroughly site conditions rather than to use these figures as the database for a particular project.
(35) See T.R. Preston, "The Role of Ruminants in the Bioconversion of Tropical By-Products and Wastes into Food and Fuel," in United Nations University, op. cit., pp. 47-53. The author is grateful to Dr. C.V. Seshadri, Director, Murugappa Chettiar Research Centre (MCRC) (Madras) for several helpful discussions on this topic.
(36) Some of the centers of microbiological research in India are ASTRA, Indian Institute of Science (Bangalore); Center for Science for Villages (Wardha); Indian Institute of Sciences (New Delhi); Maharashtra Association for the Cultivation of Science (Pune); Shri A.M.M. Murugappa Chetiar Research Centre (Madras); The National Environmental Engineering Research Institute (Nagpur); Tamil Nadu Agricultural University (Coimbatore); and Jyoti Solar Energy Institute, Vallabh Vidyanagar.
(37) See Khadi and Village Industries Commission, Gobar Gas: Why and How, 1979.
(38) D.K. Subramanian, P. Rajabapaiah and Amulya K.N. Reddy, "Studies in Biogas Technology, Part II: Optimisation of Plant Dimensions," in Proceedings of the Indian Academy of Sciences, vol. c2, Part 3 (September 1979), op. 365-379.
(39) Ibid, p. 368.
(40) Ibid, p. 373.
(41) P. Rajapapaiah et al., "Studies in Biogas Technology, Part I: Performance of a Conventional Biogas Plant," in ibid, pp. 357-63.
(42) C.R. Prasad and S.R. Sathyanarayan, "Studies in Biogas Technology, Part III: Thermal Analysis," in ibid, pp. 377-86.
(43) Amulya K.N. Reddy et al., "Studies in Biogas Technology, Part IV: A Novel Biogas Plant Incorporating a Solar Water Heater and Solar Still," in ibid, pp. 387-93.
(44) S. Bahadur and K.K. Singh, Janata Biogas Plants (1980).
(45) See E.I. DeSilva, "Biogas Generation: Development Problems and Tasks--An Overview," in United Nations University, op. cit., p. 89. For additional biogas experiences, see S.K. Subramanian, Biogas Systems in Asia (1977) and Subramanian's later abridgement of the same in Barnett et al., Biogas Technology in the Third World: A Multidisciplinary Review (1978), pp. 97-126.
(46) Personal discussions with MCRC staff, Madras.
(47) Personal discussions with John Finlay and David Fulford, Development and Consulting Service, Butwal, Nepal.
(48) Personal discussions with Dr. S.V. Patwardhan, Director, Center for Rural Development, Indian Institute of Technology (Delhi). MCRC (Madras) is also researching and developing integrated biomass systems for villages.
(49) Although the National Academy of Sciences, op. cit., pp. 61-83, contains some helpful illustrations of system planning, Reddy et al., A Community Biogas Plant System for Pura Village (1979) is a more comprehensive treatment of the type of analysis needed to design an appropriate biogas system. A more generalized, relatively simple methodology needs to be developed to enable technical teams and villagers to design energy systems jointly.
(50) John Finlay, "Operation and Maintenance of Gobar Plants" (1978), p. 3.
(51) National Academy of Sciences, op. cit., p. 85
(52) Ibid, pp. 92-93. For an excellent, extremely detailed troubleshooting methodology, see Finlay, op. cit., pp. 10-16.
(53) G.L. Patankar, Recent Developments in Gobar Gas Technology (1977), United Nations Economic and Social Commission for Asia and the Pacific (ESCAP), Report of the Workshop on Biogas Technology and Utilization (1975), p. 16.
(54) Suggested by Amulya K.N. Reddy.
(55) FAO, China: Azolla Propagation and Small-Scale Biogas Technology (1978), p. 59, and Intermediate Technology Development Group, A Chinese Biogas Manual (1979), p. 64.
(56) Discussions with villagers using the community system in Fateh Singh-Ka-Purva.
(57) Reddy et al., A Community Biogas Plant System for Pura Village (1979), pp. 36-37.
(58) Ibid, p. 80. This figure (.07 [m.sup.3]/person/day) seems low, but the methodology deriving it is correct. This suggests that a re-examination of the database nay be necessary.
(59) KVIC, ibid, p. 13. See also: Ramesh Bhatia, "Economic Appraisal of Biogas Units in India: A Framework for Social Benefit Cost Analysis," in Economic and Political Weekly (1977), pp. 1515-516, for a related discussion concerning the need for research in this area.
(60) Finlay, op. cit., pp. 4-5.
(61) Intermediate Technology Development Group, op. cit., and FAO, op. cit., pp. 50-55.
(62) See photograph, FAO, op. cit., p. 59.
(63) The author is grateful to John Finlay for this interesting aspect of prayer rituals in Nepal.
(64) P.B. Ghate, "Biogas: A Pilot Project to Investigate a Decentralized Energy System" (1978), pp. 21-22.
(65) Kirloskar Oil Engines Limited, "Kirloskar Gobar Gas Dual Fuel Engine" (1980), p. 6.
(66) K. Kasturirangan et al., "Use of Gobar Gas in a Diesel Fuel Engine" (1977).
(67) ESCAP, op. cit., p. 21.
(68) Ibid and personal discussions with Kirloskar Engineers. See also: Ramesh Bhatia, "Energy Alternatives for Irrigation Pumping: Some Results for Small Farms in North Bihar" (1979).
(69) John L. Fry, Practical Building of Methane Power Plants for Rural Energy Independence (1974), p. 39.
(70) Bhatia, op. cit., p. 1507.
(71) Cited by John Finlay, op. cit., from an earlier study by Yarwalker and Agrawal, "Manure and Fertilizers" (Nagpur: Agricultural-Horticultural Publishing House) (n.d.).
(72) Finlay, ibid.
(73) National Academy of Sciences, op. cit., p. 51.
(74) S.K. Subramanian, "Biogas Systems in Asia: A Survey" in Bennett et al., op. cit., p. 99.
(75) See the brief references to 17 percent increased wheat yield in Wu Chin County and subsequent discussion concerning Jiongsu Province, in FAO Soils Bulletin #40, op. cit., p. 47.
(76) See Andrew Barnett, "Biogas Technology: A Social and Economic Assessment," in Barnett et al., Biogas Technology in the Third World (1978), pp. 69-96; Ramesh Bhatia, "Economic Appraisal of Biogas Units in India: A Framework for Social Cost-Benefit Analysis" (1977). "Energy Alternatives for Irrigation Pumping: Some Results for Small Farm in North Bihar" (1978); Bhatia and Miriam Naimar, "Renewable Energy Sources, The Community Biogas Plant" (1979); P.B. Ghate, "Biogas: A Pilot Project to Investigate a Decentralized Energy System" (1978); KVIC, "Gobar Gas: Why and How" (1980); Indian Council of Agricultural Research, "The Economics of Cow Dung Gas Plants" (1976); Arjun Makhiajani and Alan Poole, Energy and Agriculture in the Third World (1975); T.K. Moulik, and U.K. Strivatsava, Biogas Plants at the Village Level: Problems and Prospect in Gujarat (1976) and Biogas Systems in India: A Socio-Economic Evaluation (1978); J.K. Parikh and K.S. Parikh, "Mobilization and impacts of Biogas Technologies" (1977); C.R. Prasad, K.K. Prasad, and A.K.N. Reddy, "Biogas Plants: Prospects, Problems and Tasks" (1977); K.K. Prasad and A.K.N. Reddy, "Technological Alternatives and the Indian Energy Crisis" (1977); and A.K.N. Reddy et al., A Community Biogas Plant System for Pura Village (1979).
(77) See Shishir Mukherjee and Anita Arya, "Comparative Analysis of Social Cost-Benefit Studies of Biogas Plants" (1978).
(78) See Andrew Barnett, "The Social and Economic Assessment of Biogas Technology" (1979), David French, "The Economics of Energy Technologies" (1979), and L. Squire and Herman van der Tak, Economic Analysis of Projects (1975).
(79) Islam, op. cit., p. 18.
(80) Subramaniam, S.K., Biogas Systems in Asia (1977).
(81) Islam, op. cit., pp. 46-52.
(82) For an excellent discussion of the performance of KVIC biogas systems, a socio-economic profile of users, and a solid analysis of the organizational weaknesses of the Indian biogas programme, see T.K. Moulik, U.K. Srivastava and P.M. Shingi, Biogas System in India: A Socio-Economic Evaluation (1978). The author is indebted to Dr. Srivastava for several helpful discussions on these issues.
(83) Ramesh Bhatia and Miriam Naimar, op. cit. This is a thoughtful analysis of the Fateh Singh-ka-Purva Project. See also: P.B. Ghate, "Biogas: A Pilot Project to Investigate a Decentralized Energy System" (1978), and Shahzad Bahadur and S.C. Agarwal, "Community Biogas Plant at Fateh Singh-Ka-Purva: An Evaluation Report" (Lucknow: PRAD, 1980).
(84) Bhatia and Naimar, ibid, point out that villages may actually prefer kerosene for lighting since they control the timing of its use. It would be interesting to conduct an analysis of energy consumption over time, comparing kerosene lamps and direct biogas lamps. Despite potentially higher energy efficiencies with biogas lighting methods, it is possible that a good deal of gas would be wasted due to the timed release. Once the gas is in the pipeline it is subject to pressure losses, conversion losses (running generators with no storage battery), and losses due to venting into the atmosphere if people forget to close a valve or have inefficient lamps.
(85) These reasons, coupled with an unfamiliarity with the concept of paying for a "municipal service," cast doubt on the Parikhs' notion of charging different progressive prices for the biogas. See Jyoti K. Parikh and Kirit S. Parikh, "Mobilization and Impact of Biogas Technologies," in Energy (1977). The other problem with this otherwise sensible idea is that it is not clear that poor people would be willing to cook in community kitchens even if they would receive gas free or at nominal cost. It has proven historically difficult to "purchase" such cooperative, collective living.
(86) Ibid, and T.K. Moulik and U.K. Srivastava, Biogas Plants at the Village Level: Problems and Prospects in Gujarat (1975), pp. 110-11.
(87) Bhatia and Naimar, op. cit., pp. 26-28.
(88) This section is based on discussions with a great number of rural social workers, sociologists, private voluntary organizations, and even a few difficult conversations with some villagers. I am especially grateful to Dr. Shivakumar of the Madras Institute of Development Studies, Dr. Amulya K.N. Reddy, Indian Institute of Science (Bangalore), Dr. K. Oomen, Department of Sociology, Jawaharlal Nehru University (New Delhi), Dr. C.V. Seshadri and Rathindranath Roy, MCRC (Madras), and Dr. Y. Nayudamma, Central Leather Research Institute (Madras). See also a very thoughtful article by Hermalata Dandekar, "Gobar Gas Plants: How Appropriate are They?" in Economic and Political Weekly (1980), pp. 887-92.
(89) Ibid. This excellent idea is the way many rural development teams establish their credibility and create a sense of the possible through collective effort. The Sarvodaya Movement in Sri Lanka is an example of this approach, although it goes one, perhaps necessary, step further by presenting this narrow concept of technological change within a highly developed sense of Buddhist values. Villagers respond to this because it is a natural extension of their traditional cultural ethos. Appendix
NPV and Payback Analysis for Baseline Data
Models 1 - 3
(Full cost digester, no revenue from either the sale or surplus gas or rice husk cement)
Note: For a detailed explanation of symbols used, please refer to pp. 59-61 in the text.
VITA is grateful to the Department of Computer Sciences, Indian Institute of Technology, Madras, India, for providing this printout.
MODEL 1: COOKING & LIGHTING
D = 294306.00 R = 0.00 P_DS = 0.00 R_LC = 0.04
D = 2943 6.000 G = 0.047 L = 9212.500 N_LC = 5.000 P_LC = 10.000 D_L = 273.750 G_C = 11425.000 LO_L = 43.800 P = 10000.000 R = 0.000 D_LC = 13400.000 G_L = 2300.000 LO_P = 4.800 P_D = 2.700 R_LC = 0.040 D_P = 30.120 G_P = 253.000 LO_RC = 0.000 P_DS = 0.000 D_RC = 0.000 G_RC = 0.000 M = 0.000 P_FW = 0.040 E = 33250.000 I = 4709.000 N = 0.000 P_K = 2.250
YEAR 1 2 3 4 5 6 7-1C 11-15
ANNUAL RECURRING COSTS LOAN AMORTIZATION 0.00 12724.62 12724.62 12724.62 13724.62 12724.62 0.00 0.00
ENERGY (DIESEL) 820.45 820.45 820.45 820.45 820.45 820.45 3281.75 4102.24
LUBE OIL 486.00 486.00 486.00 486.00 486.00 486.00 1944.00 2430.00
(LABOR) 8212.50 8212.50 8212.50 8212.50 8212.50 8212.50 32850.00 41062.50
OPERATIONS AND MAINTENANCE 250.00 250.00 250.00 250.00 250.00 250.00 1000.00 1250.00
TOTAL RECURRING COSTS 1556.45 14281.06 14281.06 14281.06 14281.06 14281.06 6225.75 7782.24
ANNUAL BENEFITS
ENERGY SAVED - KEROSENE 4360.50 4360.50 4360.50 4360.50 4360.50 4360.50 17442.00 21802.50
FIREWOOD 240.00 240.00 240.00 240.00 240.00 240.00 960.00 1200.00
INCREASED AGRI PRODUCTIVITY 4709.00 4709.00 4709.00 4709.00 4709.00 4709.00 18836.00 23545.00
SURPLUS ENERGY INTO DIESEL 0.00 0.00 0.00 0.00 0.00 0.00 0.00 0.00
ELECY 0.00 0.00 0.00 0.00 0.00 0.00 0.00 0.00
REVENUE FROM CCMM OPNS 0.00 0.00 0.00 0.00 0.00 0.00 0.00 0.00
TOTAL ANNUAL BENEFITS 9222.09 9222.09 9222.09 9222.09 9222.09 9222.09 36388.34 46110.43
BENEFITS-COSTS TO VILLAGE = (((ENERGY SAVED (WOOD + KEROSENE) + SALE OF SURPLUS GAS) < .981) + COMMERCIAL REVENUE + INCREASED AGRICULTURAL YIELD - LOAN AMORTIZATION + DIESEL + LUBE OIL + OPERATIONS & MAINTENANCE) 7665.64 -5058.97 -5058.97 -5058.97 -5058.97 -5058.97 30662.55 38329.18
NET PRESENT WORTH (15 YEARS): 14454.44
ANNUAL CASH FLOW ((SALE OF SURPLUS GAS + 791.00) < .991 + COMMERCIAL REVENUE) - (LOAN AMORTIZATION + DIESEL + LUBE OIL + LABOR + DP. & MAINTENANCE) -8992.97 -21717.59 -21717.59 -21717.59 -21717.59 -21717.59 -35971.89 -44564.86
NO PAYBACK
MODEL 1: COOKING & LIGHTING
D = 294306.00 R = 0.00 P_DS = 0.00 R_LC =0.10
D = 294306.000 G = 0.047 L = 8212.500 N_LC = 5.000 P_LD = 10.000 D_L = 273.750 G_C = 11425.000 LO_L = 43.800 P = 10000.000 R = 0.040 D_LC = 13400.000 G_L = 2300.000 LO_P = 4.800 P_D = 2.700 R_LC = 0.100 D_P = 30.120 G_P = 253.000 LO_RC = 0.000 P_DS = 0.000 D_RC = 0.000 G_RC = 0.000 M = 0.000 P_FW = 0.040 E = 33250.000 I = 4709.000 N = 0.000 P_K = 2.250
YEAR 1 2 3 4 5 6 7-10 11-15
ANNUAL RECURRING COSTS LOAN AMORTIZATION 0.00 14943.29 14943.29 14943.29 14943.29 14943.29 0.00 0.00
ENERGY (DIESEL) 820.45 820.45 820.45 820.45 820.45 820.45 3281.79 4102.24
LUBE OIL 486.00 486.00 486.00 486.00 486.00 486.00 1944.00 2430.00
(LABOR) 8212.50 8212.50 8212.50 8212.50 8212.50 8212.50 32850.00 41062.50
OPERATIONS AND MAINTENANCE 250.00 250.00 250.00 250.00 250.00 250.00 1000.00 1250.00
TOTAL RECURRING COSTS 1556.45 16499.73 16499.73 16499.73 16499.73 16499.73 6225.79 7782.24
ANNUAL BENEFITS
ENERGY SAVED - KEROSENE 4360.50 4360.50 4360.50 4360.50 4360.50 4360.50 17442.00 21802.50
FIREWOOD 240.00 240.00 240.00 240.00 240.00 240.00 960.00 1200.00
INCREASED AGRI PRODUCTIVITY 4709.00 4709.00 4709.00 4709.00 4709.00 4709.00 18836.00 23545.00
SURPLUS ENERGY INTO DIESEL 0.00 0.00 0.00 0.00 0.00 0.00 0.00 0.00
ELECY 0.00 0.00 0.00 0.00 0.00 0.00 0.00 0.00
REVENUE FROM CCMM OPNS 0.00 0.00 0.00 0.00 0.00 0.00 0.00 0.00
TOTAL ANNUAL BENEFITS 9222.09 9222.09 9222.09 9222.09 9222.09 9222.09 36388.34 46110.43
BENEFITS-COSTS TO VILLAGE = (((ENERGY SAVED (WOOD + KEROSENE) + SALE OF SURPLUS GAS) < .981) + COMMERCIAL REVENUE + INCREASED AGRICULTURAL YIELD - (LOAN AMORTIZATION + DIESEL + LUBE OIL + OPERATIONS & MAINTENANCE) 7665.64 -7277.64 -7277.64 -7277.64 -7277.64 -7277.64 30662.55 38323.13
NET PRESENT WORTH (15 YEARS): 6808.51
ANNUAL CAST FLOW = ((SALE OF SURPLUS GAS + 791.00) < .991 + COMMERCIAL REVENUE) - (LOAN AMORTIZATION + DIESEL + LUBE OIL + LABOR + DP. & MAINTENANCE) -8992.97 -2353.25 -23936.25 -23936.25 -23536.25 -23936.25 -35971.89 -44564.86
NO PAYBACK
MODEL 1: COOKING & LIGHTING
D = 506255.00 R = 0.00 P_DS = 0.00 R_LC =0.04
D = 506255.000 G = 0.047 L = 8212.500 N_LC = 5.000 P_LC = 10.000 D_L = 273.750 G_C = 11425.000 LO_L = 43.800 P = 10000.000 R = 0.000 D_LC = 22100.000 G_L = 2300.000 LO_P = 4.800 P_D = 2.700 R_LC = 0.040
D_P = 30.120 G_P = 253.000 LO_RC = 0.000 P_DS = 0.000 D_RC = 0.000 G_RC = 0.000 M = 0.000 P_FW = 0.040 E = 33250.000 I = 8100.000 N = 0.000 P_K = 2.250
YEAR 1 2 3 4 5 6 7-10 11-15
ANNUAL RECURRING COSTS LOAN AMORTIZATION 0.00 14678.80 14678.80 14678.80 14678.80 14678.80 0.00 0.00
ENERGY (DIESEL) 820.45 820.45 820.45 820.45 820.45 820.45 3281.75 4102.24
LUBE OIL 486.00 486.00 486.00 486.00 486.00 486.00 1944.00 2430.00
(LABOR) 8212.50 8212.50 8212.50 8212.50 8212.50 8212.50 32850.00 41062.50
OPERATIONS AND MAINTENANCE 250.00 250.00 250.00 250.00 250.00 250.00 1000.00 1250.00
TOTAL RECURRING COSTS 1556.45 16235.24 16235.24 16235.24 16235.24 16235.24 6225.79 7782.24
ANNUAL BENEFITS
ENERGY SAVED - KEROSENE 4360.50 4360.50 4360.50 4360.50 4360.50 4360.50 17442.00 21802.50
FIREWOOD 240.00 240.00 240.00 240.00 240.00 240.00 960.00 1200.00
INCREASED AGRI PRODUCTIVITY 8100.00 8100.00 8100.00 8100.00 8100.00 8100.00 32400.00 40500.00
SURPLUS ENERGY INTO DIESEL 0.00 0.00 0.00 0.00 0.00 0.00 0.00 0.00
ELECY 0.00 0.00 0.00 0.00 0.00 0.00 0.00 0.00
REVENUE FROM CCMM OPNS 0.00 0.00 0.00 0.00 0.00 0.00 0.00 0.00
TOTAL ANNUAL BENEFITS 12613.09 12613.09 12613.09 12613.09 12613.09 12613.09 50452.34 63065.43 BENEFITS-COSTS TO VILLAGE = (((ENERGY SAVED (WOOD + KEROSENE) + SALE OF SURPLUS GAS) < .981) + COMMERCIAL REVENUE + INCREASED AGRICULTURAL YIELD - (LOAN
AMORTIZATION + DIESEL + LUBE OIL + OPERATIONS & MAINTENANCE) 11056.64 -3622.15 -3622.15 -3622.15 -3622.15 -3622.15 44226.55 55283.18
NET PRESENT WORTH (15 YEARS): 33512.33
ANNUAL CASH FLOW = ((SALE OF SURPLUS GAS + 791.00) < .991 + COMMERCIAL REVENUE) - (LOAN AMORTIZATION + DIESEL + LUBE OIL + LABOR + DP. & MAINTENANCE) -8992.97 -23671.77 -23671.77 -23671.77 -23671.77 -23671.77 -35971.89 -44564.86
NO PAYBACK
MODEL 1: COOKING & LIGHTING
D = 506255.00 R = 0.00 P_05 = 0.00 R_LC = 0.10
D = 506255.000 G = 0.047 L = 8212.500 N_LC = 5.000 P_LO = 10.000 D_L = 273.750 G_C = 11425.000 LO_L = 43.800 P = 10000.000 R = 0.000 D_LC = 22100.000 G_L = 2300.000 LO_P = 4.800 P_D = 2.700 R_LC = 0.100 D_P = 30.120 G_P = 253.000 LO_RC = 0.000 P_DS = 0.000 C_RC = 0.000 G_RC = 0.000 M = 0.000 P_FW = 0.040 E = 33250.000 IA = 8100.000 N = 0.000 P_K = 2.250
YEAR 1 2 3 4 5 6 7-10 11-15
ANNUAL RECURRING COSTS LOAN AMORTIZATION 0.00 17238.20 17238.20 17238.20 17238.20 17238.20 0.00 0.00 ENERGY (DIESEL) 320.45 320.45 820.45 820.45 820.45 820.45 3281.75 4102.24 LUBE OIL 486.00 486.00 486.00 486.00 486.00 486.00 1944.00 2430.00 (LABOR) 8212.50 8212.50 8212.50 8212.50 8212.50 8212.50 32950.00 41062.50 OPERATIONS AND MAINTENANCE 250.00 250.00 250.00 250.00 250.00 250.00 1000.00 1250.00 TOTAL RECURRING COSTS 1536.45 18794.64 18794.64 18794.64 18794.64 18794.64 6225.79 7782.24
ANNUAL BENEFITS ENERGY SAVED - KEROSENE 4360.50 4360.50 4360.50 4360.50 4360.50 4360.50 17442.00 21802.50 FIREWOOD 240.00 240.00 240.00 240.00 240.00 240.00 960.00 1200.00 INCREASED AGRI PRODUCTIVITY 8100.00 8100.00 8100.00 8100.00 8100.00 8100.00 32400.00 40500.00 SURPLUS ENERGY INTO DIESEL 0.00 0.00 0.00 0.00 0.00 0.00 0.00 0.00 ELEC Y 0.00 0.00 0.00 0.00 0.00 0.00 0.00 0.00 REVENUE FROM COMM OPNS 0.00 0.00 0.00 0.00 0.00 0.00 0.00 0.00 TOTAL ANNUAL BENEFITS 12613.09 12613.09 12613.09 12613.09 12613.09 12613.09 50452.34 63065.43
BENEFITS-COSTS TO VILLAGE = (((ENERGY SAVED (WOOD + KEROSENE) + SALE OF SURPLUS GAS) + .981) + COMMERCIAL REVENUE + INCREASED AGRICULTURAL YIELD - (LOAN AMORTIZATION + DIESEL + LUBE OIL + OPERATIONS & MAINTENANCE) 11056.64 -6181.55 -6181.55 -6181.55 -6181.55 -6181.55 44226.55 55283.13
NET PRESENT WORTH (15 YEARS): 24692.20
ANNUAL CASH FLOW = ((SALE OF SURPLUS GAS + 791.001 % .981 + COMMERCIAL REVENUE) - (LOAN AMORTIZATION + DIESEL + LUBE OIL + LABOR + DP. & MAINTENANCE) -8992.97 -26231.16 -26231.16 -26231.16 -26231.16 -26231.16 -35971.39 -44964.86
NO PAYBACK
MODEL 2: COOKING, LIGHTING & INDUSTRY
D = 326579.00 R = 0.00 P_DS = 0.00 R_LC = 0.04
D = 326579. 0 G = 0.047 L = 11812.500 N_LC = 5.000 P_LO = 10.000 D_L = 273.750 G_C = 11425.000 LO_L = 43.800 P = 10000.000 R = 0.000 D_LC = 15000.000 G_L = 2300.000 LO_P = 4.800 P_D = 2.700 R_LC = 0.040 D_P = 30.120 G_P = 253.000 LO_RC = 0.000 P_DS = 0.000 C_RC = 150.000 G_RC = 1260.000 M = 4800.000 P_FW = 0.040 E = 41000.000 IA = 5225.000 N = 0.000 P_K = 2.250
YEAR 1 2 3 4 5 6 7-10 11-15
ANNUAL RECURRING COSTS LOAN AMORTIZATION 0.00 14824.80 14824.80 14824.80 14824.80 14324.80 0.00 0.00 ENERGY (DIESEL) 1225.45 1225.45 1225.45 1225.45 1225.45 1225.45 4901.79 6127.24 LUBE OIL 726.00 726.00 726.00 726.00 726.00 726.00 2904.00 3630.00 (LABOR) 11812.50 11812.50 11812.50 11812.50 11812.50 11812.50 47250.00 55062.50
OPERATIONS AND MAINTENANCE 5050.00 5050.00 5050.00 5050.00 5050.00 5050.00 20200.00 25250.00 TOTAL RECURRING COSTS 7001.44 21826.24 21826.24 21826.24 21826.24 21826.24 28005.77 35007.21
ANNUAL BENEFITS ENERGY SAVED - KEROSENE 4360.10 4360.50 4360.50 4360.50 4360.50 4360.50 17442.00 21802.50 FIREWOOD 240.00 240.00 240.00 240.00 240.00 140.00 960.00 1200.00 INCREASED AGRI PRODUCTIVITY 5225.00 5225.00 5225.00 5225.00 5225.00 5225.00 20900.00 20125.00 SURPLUS ENERGY INTO DIESEL 0.00 0.00 0.00 0.00 0.00 0.00 0.04 0.00
ELEC Y 0.00 0.00 0.00 0.00 0.00 0.00 0.00 0.00 REVENUE FROM COMM OPNS 0.00 0.00 0.00 0.00 0.00 0.00 0.00 0.00 TOTAL ANNUAL BENEFITS 9738.09 9738.09 9738.09 9738.09 9738.09 9738.09 38952.34 48690.43
BENEFITS-COSTS TO VILLAGE = (((ENERGY SAVED (WOOD + KEROSENE) + SALE OF SURPLUS GAS) + .981) + COMMERCIAL REVENUE + INCREASED + AGRICULTURAL YIELD) - (LOAN AMORTIZATION + DIESEL + LUBE OIL + OPERATIONS & MAINTENANCE) 2736.60 -12088.15 12088.15 -12088.15 -12088.15 -12088.15 -10946.58 13683.22 NET PRESENT WORTH (15 YEARS): 20273.67
ANNUAL CASH FLOW = ((SALE OF SURPLUS GAS + 791.001 % .981 + COMMERCIAL REVENUE) - (LOAN AMORTIZATION + DIESEL + LUBE OIL + LABOR + DP. & MAINTENANCE) -19037.57 -32862.77 -32862.77 -32862.77 -32862.77 -32862.77 -72151.88 -90189.8
NO PAYBACK
MODEL 2: COOKING, LIGHTING & INDUSTRY
D = 326579.00 R = 0.00 P_DS = 0.00 R_LC = 0.10
D = 326579.000 G = 0.047 L = 11812.500 N_LC = 3.001 P_LC = 10.000 D_L = 273.750 G_C = 11425.000 LC_L = 43.800 P = 10000.000 R = 0.000 D_LC = 15000.000 G_L = 2300.000 LC_P = 4.800 P_D = 2.700 R_LC = 0.100 D_P = 30.120 G_P = 253.000 LC_RC =
0.000 P_DS = 0.000 C_RC = 150.000 G_RC = 1260.000 M = 4800.000 P_FW = 0.040 E = 41000.000 IA = 5225.000 N = 0.000 P_K = 1.250
YEAR 1 2 3 4 5 6 7-10 11-15
ANNUAL RECURRING COSTS LOAN AND AMORTIZATION 0.00 17409.66 17409.66 17409.66 17409.66 17409.66 0.00 0.00 ENERGY (DIESEL) 1225.45 1225.45 1225.45 1225.45 1225.45 1225.45 4901.79 6127.24 LUBE OIL 726.00 726.00 726.00 726.00 726.00 726.00 2904.00 3630.00 (LABOR) 11812.50 11812.50 11812.50 11812.50 11812.50 11812.50 47250.00 59062.50 OPERATIONS AND MAINTENANCE 5050.00 5050.00 5050.00 5050.00 5050.00 5050.00 20200.00 25250.00 TOTAL RECURRING COSTS 7001.44 24411.10 24411.10 24411.10 24411.10 24411.10 28005.77 35007.21
ANNUAL BENEFITS ENERGY SAVED - KEROSENE 4360.50 4360.50 4360.50 4360.50 4360.50 4360.50 17442.00 21802.50 FIREWOOD 240.00 240.00 240.00 240.00 240.00 240.00 960.00 1200.00 INCREASED AGRI PRODUCTIVITY 5225.00 5225.00 5225.00 5225.00 5225.00 5225.00 20900.00 26125.00 SURPLUS ENERGY INTO DIESEL 0.00 0.00 0.00 0.00 0.00 0.00 0.00 0.00 ELEC Y 0.00 0.00 0.00 0.00 0.00 0.00 0.00 0.00 REVENUE FROM COMM OPNS 0.00 0.00 0.00 0.00 0.00 0.00 0.00 0.00 TOTAL ANNUAL BENEFITS 9738.09 9738.09 9738.09 9738.09 9738.09 9738.09 38952.34 48690.43
BENEFITS-COSTS TO VILLAGE = (((ENERGY SAVED (WOOD + KEROSENE) + SALE OF SURPLUS GAS) + .9811 + COMMERCIAL REVENUE + INCREASED AGRICULTURAL YIELDS - (LOAN AMORTIZATION + DIESEL + LUBE OIL + OPERATIONS & MAINTENANCE) 2736.64 -14673.01 -14673.01 -14673.01 -14673.01 -14673.01 10946.58 13683.22
NET PRESENT WORTH (15 YEARS): -39181.57
ANNUAL CASH FLOW = ((SALE OF SURPLUS GAS + 791.001 % .981 + COMMERCIAL REVENUE - (LOAN AMORTIZATION + DIESEL + LUBE OIL + LABOR + OP. & MAINTENANCE) -18037.97 -35447.63 -35447.63 -35447.63 -35447.63 -35447.63 -72151.88 -90189.81
NO PAYBACK
MODEL 2: COOKING, LIGHTING & INDUSTRY
D = 506255.00 R = 0.00 P_DS = 0.00 R_LC = 0.04
D = 506255.000 G = 0.041 11812.500 N LC = 5.000 P_LC = 10.000 D L = 273.750 G_C = 11425.000 LO_L = 43.800 P = 10000.000 R = 0.000 D_LC = 22107.100 G_L = 2300.000 LO_F = 4.800 P_D = 2.700 R_LC = 0.040 D_P = 30.120 G_P = 253.000 LO_RC = 0.000 P_DS = 0.000 C_RC = 150.000 G_RC = 1260.000 M = 4800.000 P_FW = 0.040 E = 41000.000 IA = 8100.000 N = 0.000 P_K = 2.250
YEAR 1 2 3 4 5 6 7-10 11-15
ANNUAL RECURRING COSTS LOAN AMORTIZATION 0.00 16419.59 16419.59 16419.59 16419.59 16419.59 0.00 0.00
ENERGY (DIESEL) 1225.45 1225.45 1225.45 1225.45 1225.45 1225.45 4901.79 6127.24 LUBE OIL 726.00 726.00 726.00 726.00 726.00 726.00 2904.00 3630.00
(LABOR) 11812.50 11812.50 11812.50 11812.50 11812.50 11812.50 47250.00 59062.50
OPERATIONS AND MAINTENANCE 5050.00 5050.00 5050.00 5050.00 5050.00 5050.00 20200.00 25250.00
TOTAL RECURRING COSTS 7001.44 23421.03 23421.03 23421.03 23421.03 23421.03 28005.77 35007.21
ANNUAL BENEFITS ENERGY SAVED - KEROSENE 4360.50 4360.50 4360.50 4360.50 4360.50 4360.50 17442.00 21802.50 FIREWOOD 240.00 240.00 240.00 240.00 240.00 240.00 960.00 1200.00
INCREASED AGRI PRODUCTIVITY 8100.00 8100.00 8100.00 8100.00 8100.00 8100.00 32400.00 40500.00
SURPLUS ENERGY INTO DIESEL 0.00 0.00 0.00 0.00 0.00 0.00 0.00 0.00 ELEC Y 0.00 0.00 0.00 0.00 0.00 0.00 0.00 0.00
REVENUE FROM COMM OPNS 0.00 0.00 0.00 0.00 0.00 0.00 0.00 0.00
TOTAL ANNUAL BENEFITS 12613.09 12613.09 12613.09 12613.09 12613.09 12613.09 50452.34 63065.43
BENEFITS-COSTS IN VILLAGE = ((( ENERGY SAVED (WOOD + KEROSENE)
+ SALE OF SURPLUS GAS) + .981) + COMMERCIAL REVENUE + INCREASED + AGRICULTURAL YIELD - (LOAN AMORTIZATION + DIESEL + LUBE OIL + OPERATIONS & MAINTENANCE) 5611.64 -10807.94 -10807.94 -10807.94 -10807.94 -10807.94 22446.58 28058.22
NET PRESENT WORTH (15 YEARS): -13902.12
ANNUAL CASH FLOW = ((SALE OF SURPLUS GAS + 191.001 % .981 + COMMERCIAL REVENUE - (LOAN AMORTIZATION + DIESEL + LUBE OIL + LABOR + DP. & MAINTENANCE) -13037.57 -34457.55 -34457.55 -34457.55 -34457.55 -34457.55 -72151.66 -90185.61
NO PAYBACK
MODEL 2: COOKING, LIGHTING & INDUSTRY
O = 506255.00 R = 0.00
P_OS = 0.00 R_LC = 0.10
O = 506255.000
G = 0.047
L = 11812.500
N_LC = 5.000 P_LC = 10.000
O_L = 273.750 G_C = 11425.000
LO_L = 43.800
P =10000.000 R = 0.000 O_LC = 22100.000 G_L = 2300.000 LC_P = 4.800 P_D = 2.700 R_LC = 0.100 O_P = 30.120 G_P = 253.000 LC_RC = 0.000 P_DS = 0.000 0.000 P_FW = 0.040 O_RC = 150.000 G_RC = 1260.000 M = 4800.000
E = 41000.000 1A= 8100.000 N = 0.000 P_K = 2.250
YEAR 1 2 3 4 5 6 7-10 11-15
ANNUAL RECURRING COSTS LOAN AMORTIZATION 0.00 19282.51 19282.51 19282.51 19282.51 19282.51 0.00 0.00 ENERGY (DIESEL) 1225.45 1225.45 1225.45 1225.45 1225.45 1225.45 4901.79 6127.24 LUBE OIL 726.00 726.00 726.00 726.00 726.00 726.00 2904.00 3630.00 (LABOR) 11812.50 11812.50 11812.50 11812.50 11812.50 11812.50 47250.00 59062.50 OPERATIONS AND MAINTENANCE 5050.00 5050.00 5050.00 5050.00 5050.00 5050.00 20200.00 25250.50 TOTAL RECURRING COSTS 7001.44 26283.95 26283.95 26283.95 26283.95 26283.95 28005.77 35007.21
ANNUAL BENEFITS ENERGY SAVED - KEROSENE 4360.50 4360.50 4360.50 4360.50 4360.50 4360.50 17442.00 21802.50 FIREWOOD 240.00 240.00 240.00 240.00 240.00 240.00 960.00 1200.00 INCREASED AGRI PRODUCTIVITY 8100.00 8100.00 8100.00 8100.00 8100.00 8100.00 32400.00 40500.00 SURPLUS ENERGY INTO DIESEL 0.00 0.00 0.00 0.00 0.00 0.00 0.00 0.00 ELEC Y 0.00 0.00 0.00 0.00 0.00 0.00 0.00 0.00 REVENUE FROM COMM OPNS 0.00 0.00 0.00 0.00 0.00 0.00 0.00 0.00 TOTAL ANNUAL BENEFITS 12613.09 12613.09 12613.09 12613.09 12613.09 12613.09 50452.34 63065.43
BENEFITS-COSTS TO VILLAGE = (((ENERGY SAVED (WOOD + KEROSENE) + SALE OF SURPLUS GAS) + .9811 + COMMERCIAL REVENUE + (INCREASED AGRICULTURAL YIELDS) - (LOAN AMORTIZATION + DIESEL + LUBE OIL + OPERATIONS & MAINTENANCE) 5611.64 -13670.87 -13670.87 -13670.87 -13670.87 -13670.87 22446.58 28058.22
NET PRESENT WORTH (15 YEARS): -23768.18
ANNUAL CASH FLOW = ((SALE OF SURPLUS GAS + 791.001 +.981 + COMMERCIAL REVENUE) - (LOAN AMORTIZATION + DIESEL + LUBE OIL + LABOR + OP. & MAINTENANCE) -18037.97 -37320.48 -37320.48 -37320.48 -37320.48 -37320.48 -72151.88 -90189.81
NO PAYBACK
MODEL 3: LIGHTING & INDUSTRY
O = 86021.00 R = 0.00 P_DS = 0.00 R_LC = 0.04
O = 86121.000 G = 0.041 L = 11812.500 N_LC = 5.000 P_LC = 10.000 O_L = 273.750 G_C = 0.000 LO_L = 43.800 P = 0.000 R = 0.000 O_LC = 4500.000 G_L = 2300.000 LO_F = 4.800 P_D = 2.700 R_LC = 0.040 O_P = 30.120 G_P = 253.000 LO_RC = 0.000 P_DS = 0.000 O_RC = 150.000 G_RC = 1260.000 M = 4807.000 P_FW = 0.020 E = 41000.000 IA = 1376.000 N = 0.000 P_K = 2.250
YEAR 1 2 3 4 5 6 7-10 11-15
ANNUAL RECURRING COSTS LOAN AMORTIZATION 0.00 10220.13 10220.13 10220.13 10220.13 10220.13 0.00 0.00 ENERGY (DIESEL) 1225.45 1225.45 1225.45 1225.45 1225.45 1225.45 4901.79 6127.24 LUBE OIL 726.00 726.00 726.00 726.00 726.00 726.00 2904.00 3630.00 (LABOR) 11812.50 11812.50 11812.50 11812.50 11812.50 11812.50 47250.00 55062.50 OPERATIONS AND MAINTENANCE 5050.00 5050.00 5050.00 5050.00 5050.00 5050.00 20200.00 25250.00 TOTAL RECURRING COSTS 7001.44 17221.57 17221.57 17221.57 17221.57 17221.57 28005.77 35007.21
ANNUAL BENEFITS ENERGY SAVED - KEROSENE 4360.50 4360.50 4360.50 4360.50 4360.50 4360.50 17442.00 21802.50 FIREWOOD 120.00 120.00 120.00 120.00 120.00 120.00 480.00 600.00 INCREASED AGRI PRODUCTIVITY 1376.00 1376.00 1376.00 1376.00 1376.00 1376.00 5504.00 6880.00 SURPLUS ENERGY INTO DIESEL 0.00 0.00 0.00 0.00 0.00 0.00 0.00 0.00 ELEC Y 0.00 0.00 0.00 0.00 0.00 0.00 0.00 0.00 REVENUE FROM COMM OPNS 0.00 0.00 0.00 0.00 0.00 0.00 0.00 0.00 TOTAL ANNUAL BENEFITS 5771.36 5771.36 5771.36 5771.36 5771.36 5771.36 23085.45 28856.82
BENEFITS-COSTS IN VILLAGE = (((ENERGY SAVED (WOOD + KEROSENE) + SALE OF SURPLUS GAS) + .9811 + COMMERCIAL REVENUE + INCREASED AGRICULTURAL YIELDS) - (LOAN AMORTIZATION + DIESEL + LUBE OIL + OPERATIONS & MAINTENANCE) -1230.08 -11450.20 -11450.20 -11450.20 -11450.20 -11450.20 -4920.31 -6150.89
NET PRESENT WORTH (15 YEARS): -44576.51
ANNUAL CASH FLOW = ((SALE OF SURPLUS GAS + 791.001 + .981 + COMMERCIAL REVENUE) - (LOAN AMORTIZATION + DIESEL + LUBE OIL + LABOR + OP. & MAINTENANCE) -18087.97 -28258.09 -28258.09 -28258.09 -28258.09 -28258.09 -72151.88 -90189.81
NO PAYBACK
MODEL 3: LIGHTING & INDUSTRY
O = 86071.00 R. 0.00 P_DS = 0.00 R_LC = 0.10
O = 86021.00 G = 0.047 I = 11812.500 N_LC = 5.000 P_LD = 10.000 O_L = 273.750 G_C = 0.000 LO_L = 43.800 P = 0.000 R = 0.000 O_LC = 4500.000 G_L = 2300.000 LO_P = 4.800 P_D = 2.100 R_LC = 0.100 O_P = 30.120 G_P = 253.000 LO_RC = P_DS = 0.000 0.000 P_FW = 0.020 O_RC = 150.000 G_RC = 1260.000 M = 4800.000 P_K = 2.250 E = 41000.000 IA = 1376.000 N = 0.000
YEAR 1 2 3 4 5 6 7-10 11-15
ANNUAL RECURRING COSTS LOAN AMORTIZATION 0.00 12002.11 12002.11 12002.11 12001.11 12002.11 0.00 0.00 ENERGY (DIESEL) 1225.45 1225.45 1225.45 1225.45 1225.45 1225.45 4901.75 6127.24 LUBE OIL 726.00 726.00 726.00 726.00 726.00 726.00 2904.00 3630.00 (LABOR) 11812.50 11812.50 11812.50 11812.50 11812.50 11812.00 47250.00 59062.50 OPERATIONS AND MAINTENANCE 5050.00 5050.00 5050.00 5050.00 5050.00 5050.00 20200.00 25250.00 TOTAL RECURRING COSTS 7001.44 19003.55 19003.55 19003.55 19003.55 19003.55 28005.77 35007.21
ANNUAL BENEFITS
ENERGY SAVED - KEROSENE 4360.50 4360.50 4360.50 4360.50 4360.50 4360.50 17442.00 21802.50 FIREWOOD 120.00 120.00 120.00 120.00 120.00 120.00 480.00 600.00 INCREASED AGRI PRODUCTIVITY 1376.00 1376.00 1376.00 1376.00 1376.00 1376.00 5504.00 6880.00 SURPLUS ENERGY INTO DIESEL 0.00 0.00 0.00 0.00 0.00 0.00 0.00 0.00 ELEC Y 0.00 0.00 0.00 0.00 0.00 0.00 0.00 0.00 REVENUE FROM COMM OPNS 0.00 0.00 0.00 0.00 0.00 0.00 0.00 0.00 TOTAL ANNUAL BENEFITS 5771.36 5771.36 5771.36 5771.36 5771.36 5771.36 23085.45 28856.82
BENEFITS-COSTS IN VILLAGE = (((ENERGY SAVED (WOOD + KEROSENE) + SALE OF SURPLUS GAS) + .9811 + COMMERCIAL REVENUE + INCREASED AGRICULTURAL YIELDS) - (LOAN AMORTIZATION + DIESEL + LUBE OIL + OPERATIONS & MAINTENANCE) -1230.08 -13232.19 -13232.19 -13232.19 -11232.19 13232.19 -4920.31 -6150.35
NET PRESENT WORTH (15 YEARS): -50717.55
ANNUAL CASH FLOW = ((SALE OF SURPLUS GAS) + 791.001 + .981 + COMMERCIAL REVENUE) - (LOAN AMORTIZATION + DIESEL + LUBE OIL + LABOR + OP. & MAINTENANCE) -18037.51 -30040.08 -30040.08 -30040.08 -30040.08 -30040.08 -72151.88 -90189.81
NO PAYBACK
MODEL 3: LIGHTING & INDUSTRY
D= 506255.00 R = 0.00 P_DS = 0.00 R_LC = 0.04
O = 506255.000 G = 0.041 L = 11812.500 N_LC = 5.000 P_LC = 10.000 O_L = 273.750 G_C = 0.000 LO_L = 43.800 P = 0.000 R = 0.000 D_LC = 22100.000 G_I = 2300.000 LO_F = 4.800 P_D = 2.700 R_LC= 0.040 O_P = 30.120 G_P = 253.000 LO_RC = 0.000 P_DS = 0.000 O_RC = 150.000 G_RC= 1260.000 M = 4800.000 P_FW = 0.020 E = 41000.000 IA = 8100.000 N = 0.000 P_K = 2.250
YEAR 1 2 3 4 5 6 7-10 11-15
ANNUAL RECURRING COSTS LOAN AMORTIZATION 0.00 14173.41 14173.41 14173.41 14173.41 14173.41 0.00 0.00 ENERGY (DIESEL) 1225.45 1225.45 1225.45 1225.45 1225.45 1225.45 4901.79 6127.24 LUBE OIL 726.00 726.00 726.00 726.00 726.00 726.00 2904.00 3630.00 (LABOR) 11812.50 11812.50 11812.50 11812.50 11812.50 11812.50 47250.00 59062.00 OPERATIONS AND MAINTENANCE 5050.00 5050.00 5050.00 5050.00 5050.00 5050.00 20200.00 25250.00 TOTAL RECURRING COSTS 7001.44 21174.85 21174.85 21174.85 21174.85 21174.85 28005.77 35007.21
ANNUAL BENEFITS ENERGY SAVED - KEROSENE 4160.50 4360.50 4360.50 4360.50 4360.50 4360.50 17442.00 21802.50
FIREWOOD 120.00 120.00 120.00 120.00 120.00 120.00 480.00 600.00 INCREASED AGRI PRODUCTIVITY 8100.00 8100.00 8100.00 8100.00 8100.00 8100.00 32400.00 40500.00 SURPLUS ENERGY INTO DIESEL 0.00 0.00 0.00 0.00 0.00 0.00 0.00 0.00 ELEC Y 0.00 0.00 0.00 0.00 0.00 0.00 0.00 0.00 REVENUE FROM COMM OPNS 0.00 0.00 0.00 0.00 0.00 0.00 0.00 0.00 TOTAL ANNUAL BENEFITS 12495.36 12495.36 12495.36 12496.36 12496.36 12496.36 49981.45 62476.82
BENEFITS-COSTS TO VILLAGE = (((ENERGY SAVED (WOOD + KEROSENE) + SALE OF SURPLUS GAS) + .9811 + COMMERCIAL REVENUE + INCREASED AGRICULTURAL YIELD) - (LOAN AMORTIZATION + DIESEL + LUBE OIL + OPERATIONS & MAINTENANCE) 5493.92 -8679.98 -8679.48 -8679.48 -8679.48 -8679.48 21975.69 27469.61
NET PRESENT WORTH (15 YEARS): -7056.68
ANNUAL CASH FLOW = ((SALE OF SURPLUS GAS) + 791.001 +.981 + COMMERCIAL REVENUE) - (LOAN AMORTIZATION + DIESEL + LUBE OIL + LABOR + OP. & MAINTENANCE) -18037.57 -32211.38 -32211.38 -32211.38 -32211.38 -32211.38 -72151.88 -90189.81
NO PAYBACK
MODEL 3 : LIGHTING & INDUSTRY
D = 506255.00 R = 0.00 P_0S = 0.00 R_LC = 0.10
D= 506255. 00 G= 0.041 L= 11812.500 N_LC= 5.000 P_LO= 10.000 O_L= 273.750 G_C= 0.000 LO_L= 43.800 P= 0.000 R= 0.000 O_LC= 22100.000 G_L= 2300.000 LC_F= 4.800 P_D= 2.700 R_LC= 0.100 O_P= 30.170 G_P= 253.000 LC_RC= 0.000 P_DS= 0.000 O_BC= 150.000 G_RC= 1260.000 M= 4300.000 P_PW= 0.020 E= 41000.000 L = 8100.000 A= 0.000 P_X= 2.250
YEAR 1 2 3 4 5 6 7-10 11-15
ANNUAL RECURRING COSTS LOAN AMORTIZATION 0.00 16644.68 16644.68 16644.68 16644.68 16644.68 0.00 0.00 ENERGY (DIESEL) 1225.45 1225.45 1225.45 1225.45 1225.45 1225.45 4901.79 6127.24 LUBE OIL 726.00 726.00 726.00 726.00 726.00 726.00 2904.00 3630.00 11812.50 11812.50 11812.50 11812.50 11812.50 11812.50 47250.00 59062.50 OPERATIONS AND MAINTENANCE 5050.00 5050.00 5050.00 5050.00 5050.00 5050.00 20200.00 25250.00 TOTAL RECURRING COSTS 7001.44 23646.13 23646.13 23646.13 23646.13 23646.13 28005.77 35007.21
ANNUAL BENEFITS ENERGY SAVED - KEROSENE 4360.50 4360.50 4360.50 4360.50 4360.50 4360.50 17442.00 21802.50 FIREWOOD 120.00 120.00 120.00 120.00 120.00 110.00 480.00 600.00 INCREASED AGRI PRODUCTIVITY 8100.00 8100.00 8100.00 8100.00 8100.00 8100.00 32400.00 60500.00 SURPLUS ENERGY INTO DIESEL 0.00 0.00 0.00 0.00 0.00 0.00 0.00 0.00 ELECY 0.00 0.00 0.00 0.00 0.00 0.00 0.00 0.00 REVENUE FROM COMM OPNS 0.00 0.00 0.00 0.00 0.00 0.00 0.00 0.00
TOTAL ANNUAL BENEFITS 12495.66 12495.36 12495.36 12495.36 12495.34 12495.36 49981.45 62476.32
BENEFITS-COSTS IN VILLAGE = (((ENERGY SAVED LOAN KEROSENED) * SALE OF SURPLUS GAS) (.981) * COMMERCIAL REVENUE - INCREASED AGRICULTURAL YIELDS - (LOAN AMORTIZATION & DIESEL + LURF OIL * OPERATIONS & MAINTENANCE) 5493.92 -11150.76 -11150.76 -11150.76 -11150.16 -11150.76 21915.65 27469.61
NET PRESENT WORTH (15 YEARS): -1557 .17
ANNUAL CASH FLOW = ((SALE OF SURPLUS GAS (751.00) 1.981 * COMMERCIAL REVENUE - (LOAN AMORTIZATION * DIESEL * LURF OIL * LABOR * OP. & MAINTENANCE) -18037.57 -34682.65 -34682.65 -34682.65 -34682.65 -34682.65 -78151.89 -90189.81
Bibliography
"Action Research in Community Biogas," in Voluntary Action. New Delhi: Association of Voluntary Agencies for Rural Development, September 1980.
Bahadur, Shahzad and Singh, K.K. Janata Biogas Plants. Lucknow, Uttar Pradesh: Planning Research and Action Division, State Planning Institute, U.P., 1980.
Barnett, Andrew; Pyle, Leo; and Subramanian, S.K. Biogas Technology in the Third World: A Multi-disciplinary Review. Ottawa: International Development Research Centre, 1978.
Bhatia, Ramesh. "Economic Appraisal of Biogas Units in India: Framework for Social Benefit-Cost Analysis." Economic and Political Weekly 12 (1977): nos. 13-14.
A Community Biogas Plant System for Pura Village. Bangalore: Karnataka State Council for Science and Technology, 1979.
Dandekar, Hematalata. "Gobar Gas Plants: How Appropriate are They." Economic and Political Weekly 15 (May 17, 1980).
Das, C.R. and Ghathekar, S.D. "Replacement of Cowdung by Fermentation of Aquatic and Terrestrial Plants for use as a Fuel, Fertilizer, and Biogas Plant Feed," in Documentation Notes. Bombay: Tata Energy Research Institute, January 1980.
Desai, Ashok. "India's Energy Consumption: Composition and Trends," Energy Policy. September 1978.
"Efficient, Reliable Cattle Dung Gas Plants: Up-to-date Development in Nepal." Bangkok: Expert Group Meeting on Biogas Development, U.N. Economical Social Committee for Asia and the Pacific, June 1978.
FAO. China: Recycling of organic wastes in Agriculture. FAO Soils Bulletin, no. 40. Rome: FAO, 1978.
FAO. China: Azolla Propagation and Small-Scale Biogas Technology. FAO Soils Bulletin, no. 41. Rome: FAO, 1979.
Finlay, John H. Operation and Maintenance of Gobar Gas Plants. Butwal, Nepal: Development and Consulting Services, United Mission to Nepal, 1978.
Fry, L. John. Practical Building of Methane Power Plants for Rural Energy Independence. Andover, Hampshire, U.K.: Chapel River Press, 1974.
Ghate, P.B. "Biogas: A Pilot Project to Investigate a Decentralized Energy System." Lucknow, Uttar Pradesh: PRAD, State Planning Institute, U.P., 1978.
Indian Council of Agricultural Research. The Economics of Cow Dung Gas Plants. New Delhi: Indian Council of Agricultural Research, 1976.
India's Energy Economy: Facts and Their Interpretation. Bombay: Center for Monitoring Indian Economy, 1980.
Intermediate Technology Development Group (ITDG). A Chinese Biogas Manual. London: ITDG, 1979.
Islam, M.N. A Report on Biogas Programme of China (sic). Dacca: Department of Chemical Engineering, Bangladesh University of Engineering and Technology, 1979.
Kasturirangan, K., et al. "Use of Gobar Gas as Direct Fuel." Available from the Department of Mechanical Engineering, Indian Institute of Technology, Madras.
Makhijani, Arjun. "Energy Policy for Rural India," Economic-Political Weekly, special issue (August 1977): 145-164.
Makhijani, Arjun and Poole, Alan. Energy and Agriculture in the Third World. Cambridge, MA: Ballinger Publishing Co., 1975.
McGarry, Michael and Stainforth, Jill. Compost, Fertilizer, and Biogas Production from Human and Farm Wastes in the People's Republic of China. Ottawa: International Development Research Centre, 1978.
Methane Generation from human, Animal, and Agricultural Wastes. Washington, D.C.: 1977.
Moulik, T.K. and Srivastava, U.K. Biogas Plants at the Village Level: Problems and Prospects in Gujarat. Ahmedabad: Center for Management in Agriculture, Institute of Management, 1975.
Moulik, T.K. and Srivastava, U.K.; and Singh, P.M. Biogas Systems in India: A Socio-Economic Evaluation. Ahmedabad: Indian Institute of Management, 1978.
Mukharjee, S.K. and Arya, Anita. Comparative Analysis of Social Cost Benefit Studies of Biogas Plants. Ahmedabad: Indian Institute of Management, 1979.
National Academy of Sciences (NAS). Making Aquatic Weeds Useful: Some Perspectives for Developing Countries. Washington, D.C.: NAS, 1976.
National Council of Applied Economic Research. Survey of Rural Energy Consumption in Northern India. 1977.
Parikh, Jyoti K., and Parikh, Kirit S. "Mobilization and Impacts of Biogas Technologies." Energy, vol. 2. London: Pergamon Press, 1977: 441-55.
Patankar, G.L. Recent Developments in Gobar Gas Technology. Bombay: Gobar Gas Development Centre, Khadi and Village Industries Commission, 1977.
Prasad, C.R.; Prasad, K.K.; and Reddy, Amulya K.N. "Biogas Plants: Prospects, Problems and Tasks" in Economic and Political Weekly 11 (August 1974): 1347-64.
Prasad, N.B. et al. Report of the Working Group on Energy Policy. New Delhi: Planning Commission, Government of India, 1979.
Reddy, Amulya K.N. et al. "Studies in Biogas Technology: Parts I-IV," "Performance of a Conventional Biogas Plant," "Optimisation of Plant Dimensions," "Thermal Analysis," and "A Novel Biogas Plant Incorporating a Solar Water Heater and Solar Still" in Proceedings of the Indian Academy of Sciences, vol. C2, part 3. Bangalore: Indian Institute of Sciences, September 1979: 357-96.
Reddy, Amulya K.N. and Prasad, K. Krishna. "Technological Alternatives and the Indian Energy Crisis" in Economic and Political Weekly, special issue (August 1977): 1465-502.
Revelle, Roger. "Energy Use in Rural India," Science (June 4,1976): 969-475.
Ru-Chen, Chen et al. "A Biogas Power Station in Foshan: Energy From Night Soil." Guangzhou, China: Guangzhou Institute of Energy Commission, 1978.
Sathianathan, M.A. Biogas: Achievements and Challenges. New Delhi: Association of Voluntary Agencies for Rural Development, 1975.
Subramanian, S.K. Biogas Systems in Asia. New Delhi: Management Development Institute, 1977.
United Nations Economic and Social Commission for Asia and Pacific (ESCAP). Report of the Workshop on Biogas Technology and Utilization. Bangkok: ESCAP, 1975.
United Nations University (UNU). Bioconversion of Organic Residues for Rural Communities. UNU: Tokyo, 1979, especially:
DaSilva, E.J. "Biogas Generation: Developments, Problems, and Tusles--An Overview."
Matsuzaki, T. "Continuous Composting System for Disposal and Utilization of Animal Wastes at the Village Level."
Preston, T.R. "The Role of Ruminants in the Bioconversion of Tropical By-products and Wastes into Food and Fuel.
Seshadri, C.V. "Analysis of Bioconversion Systems at the Village Level."