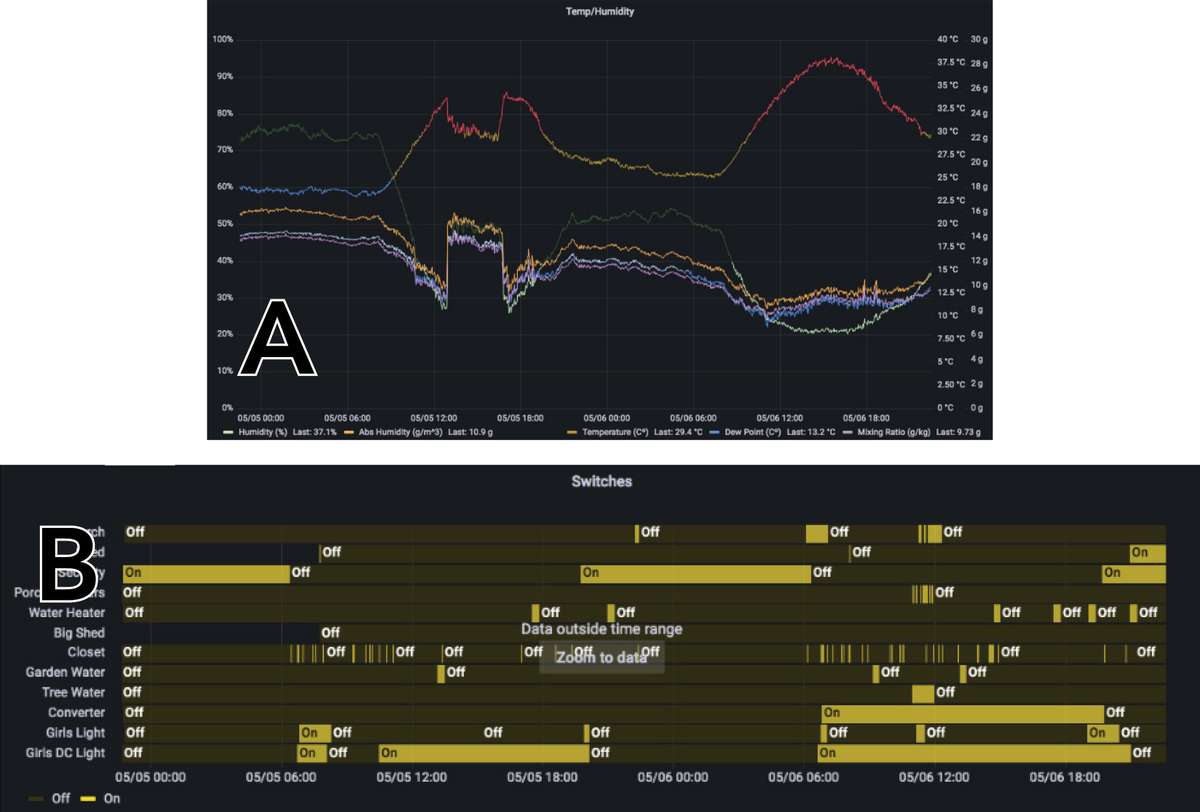
Figure 15. Examples of graphs showing sensor data (A) and switch states (B). Source: Andrew Lotze
You are sharing: EDN156 Figure 15
