Introduction and Purpose
Soil and plant health can be addressed together, separately, or not at all in crop management practices. Natural farming techniques include low-resource approaches to meeting plant and/or soil health needs. Natural farming proponents consider biological aspects of agricultural production to be just as important as the chemical aspects (Mikkelson, 2005). Many different approaches to natural farming techniques have arisen, with variations are typically connected to regional differences in preferences and resources (e.g. Korean vs. Thai Natural Farming). Natural farming products include various “on-farm” recipes, many of which are produced through fermentation of soil, plant, animal, or other natural materials.
One natural farming product called indigenous microorganisms (IMO) has been touted as a natural, low-input equivalent of the commercial product, effective microorganisms (EM®). EM is a cocktail microbial product that includes several strains of microorganisms known to be beneficial for soil and/or plant health. EM formulations vary based on the local manufacturing company as well as the type of product purchased. Mayer et al. (2010) found no soil health or crop yield benefit from using EM in a temperate climate. Few long-term research initiatives have investigated the effectiveness of EM or IMO on soil or plant health in tropical climates. Table 1 outlines benefits and concerns around IMO and EM. For a more detailed discussion comparing EM and IMO, see Berkelaar (2011).
| IMO | EM | |
|---|---|---|
|
Benefits |
|
|
|
Concerns |
|
|
Natural farming techniques have been heavily promoted in ECHO Asia’s network. There has been insufficient long-term research evaluating the effectiveness of indigenous microorganisms (IMO) as a soil drench in benefiting crop health, growth, or production. The purpose of this trial was to evaluate the potential benefits of IMO, EM, and mulching on crop physiology, soil microbiology, and yield. A secondary purpose of the trial was to assess the efficacy of EM and IMO with and without synthetic fertilizer.
Materials and Methods
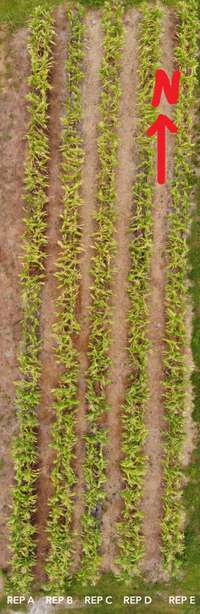
Figure 1. Trial Design. Source: Noah Coleman
Trial Design
Between 2017 and 2018, a trial was conducted comparing IMO, EM, mulch, and no mulch on a raised bed system on the ECHO Florida campus (North Fort Myers, zone 9a/10b; Figure 1). Each of these main treatments were evaluated with and without NPK fertilizer in a split-plot, randomized complete block design.
Treatments
Main treatments included;
- a no-mulch control,
- mulched beds,
- mulched beds with IMO biweekly soil drench application, and
- mulch beds with EM biweekly soil drench application.
Split treatments included:
- Synthetic 8-2-8 (8% nitrogen [N]-2% phosphorus [P]-8% potassium [K] fertilizer)
- No NPK fertilizer
Main treatments were randomly assigned to a plot in each of five blocks (replications). The main treatment for each plot was applied over the entire plot. A split treatment (NPK or no NPK) was then randomly assigned to each half of every plot.
The mulch used for mulch-containing treatments was coarse straw about one inch in thickness placed on the surface of the plots at the beginning of each growing season. Buffers between treatments were 1 m in length and were cultivated with the same crops as were in the treated plots. Buffers were included to prevent cross-contamination between treatments, as the soil drench was liquid and could otherwise seep across plots.
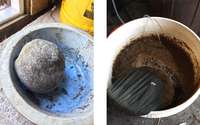
Figure 2. Procedure of making IMO-1. Source: Stacy Swartz
IMO-1, also known as IMO-liquid, was made following a protocol outlined by Jensen et al. (2006). The sugar source utilized for the recipe was molasses. Soil utilized for the recipe was taken from a healthy raised bed under annual production with the hopes of culturing bacteria that are beneficial for annual production (Figure 2).
The EM product Quantum-VSC® was purchased from a local retailer and utilized as the EM source. Following guidance from ECHO network member, Keith Mikkelson, EM was activated 1 week prior to each application. To activate, 30 mL of EM was added to 30 mL of molasses and 900 mL of water and fermented for 1 week before application.
Biweekly applications of IMO and EM soil drenches consisted of a 1:300 dilution of IMO and EM equally distributed at the base of plant stems within each treatment (37.8 mL IMO/EM per 13.6=L [3-gallon]) application across all plants within the treatment unit).
Fertilization of split treatments with synthetic 8-2-8 occurred at planting, four weeks after planting, and at flowering for maize while it was applied as a preplant and at four weeks for both cabbage and Ethiopian kale. Target N application was 80 kg N/ha for both cabbage and Ethiopian kale and was 23 kg N/ha for corn.
Coragen® was sprayed alternating with Bacillus thuringiensis on an as-need basis to control for larval lepidoptera pests. Weeds were managed within the beds by frequent hand-pulling while walkways between beds were sprayed with Cornerstone® (active ingredient glyphosate).
Crops
Crops grown include (Figure 3):
- maize (Zea mays) during the hot, humid summer months 2017 and 2018
- cabbage (Brassica oleracea var. capitata) during the cool, dry winter months 2018
- Ethiopian kale (Brassica carinata) during the cool, dry winter months 2017
Crops were grown in three-foot wide raised beds oriented North-South with two lines of drip irrigation per bed. The drip irrigation had slits every 18 inches and was 100 mm thick (Figure 1). Maize was double seeded every 20 cm and thinned to one seedling at 2 weeks after seeding. Cabbage and kale plants were seeded into trays in a greenhouse then transplanted at 30 cm spacing.
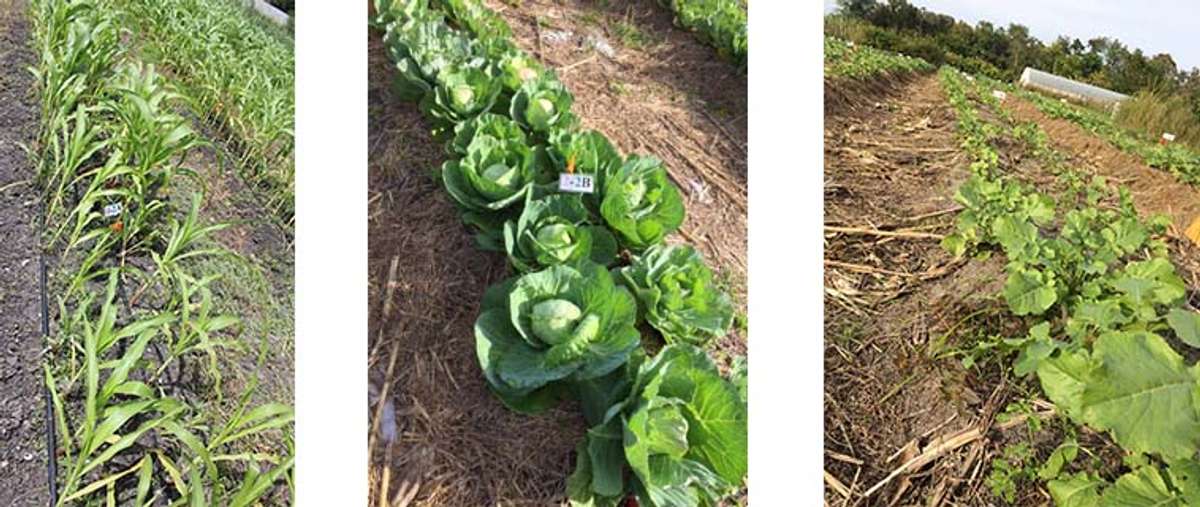
Figure 3. Crops grown in raised beds. Source: Stacy Swartz
Data Collection
Microbial life
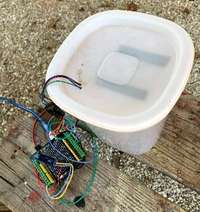
Figure 4. Homemade CO2 sensor. Source: Tim Motis
CO2
Soil life was approximated through the measurement of soil respiration (output of CO2) from sieved soil samples. Samples were taken using a soil core sampler of the first 5-10 cm of soil below the mulch of each main treatment. At each sample period, a total of 6 random cores were sampled per plot for each main treatment. Samples were sieved with a screen with pore size of 2 mm (10 mesh) to exclude large roots. CO2 was measured using a homemade, arduino-based system for sensing CO2 (see Github for more details). The sensor and supporting components cost $35 to $60 to construct, depending on how much of the material one already has on hand (Figure 4). Samples were taken before, at the height of N accumulation, and at harvest for each cropping cycle.
Cotton strip assay
One way to estimate soil microbial activity is to measure how fast cotton decomposes in the soil (Bly, 2020). Cotton is a source of carbon, which microbial life uses for metabolic activity. Cotton strips were cut from identical Fruit of the Loom® t-shirts and weighed. Each strip was then heat-sealed into a mesh bag (made from mosquito netting). Mesh bags were then buried 5 cm under the soil surface in the center of each non-fertilized subplot between the crop rows. After one month, mesh bags were carefully excavated, washed, and dried at room temperature. Cotton strips were then reweighed.
Yield
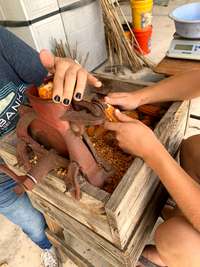
Figure 5. Small rotary hand sheller used to shell maize. Source: Stacy Swartz
Maize
At harvest, ears were harvested, shucked in-field, and counted before drying in a forced-air dryer until seeds reached a moisture content of approximately 15%. Ears were then shelled by hand with a small rotary hand sheller
(Figure 5) and grain was weighed.
Cabbage
Cabbages were monitored twice weekly around harvest window to capture harvest at peak maturity. Cabbages were cut just beneath the head and harvested when centers were firm, but not yet split. Cabbages were counted and weighed.
Ethiopian Kale
Ethiopian kale plants were monitored twice weekly around the harvest window to capture harvest at peak maturity. During the period of peak maturity, kale leaves were harvested and weighed on a weekly basis. Leaves selected for harvest were those considered marketable (large enough to be consumed).
Results and Discussion
Microbial life
CO2
Over each CO2 sampling period, CO2 increased over time (Figure 6). There was no significant difference in CO2 accumulation between crop seasons (P<0.10) therefore, data were combined for both seasons to compare main treatments. CO2 accumulation did not differ among main treatments (P=0.16). Figure 6 shows the effect of main treatments on CO2 accumulation over time, with CO2 data averaged across crops (maize, cabbage, and kale). Trend lines are fit to the data using quadratic formulas (all R2 values > 0.97). Biologically this makes sense as the CO2 released into the container from the living microbiome in the soil will increase until it equilibrates with atmospheric gases entering the container through the small puncture hole in the top of the container.
Although no differences were observed between treatments, the sampling procedure did provide an affordable, accessible option for approximating microbial life that could be used in other applications. The sieve used may not have excluded small roots or root hairs which may have skewed the respiration of CO2 observed. Soil moisture at each sampling also may have affected rates of microbial respiration during the sample periods. In the future, samples should be sieved with a higher mesh, if possible, and brought to the same moisture level before sampling.
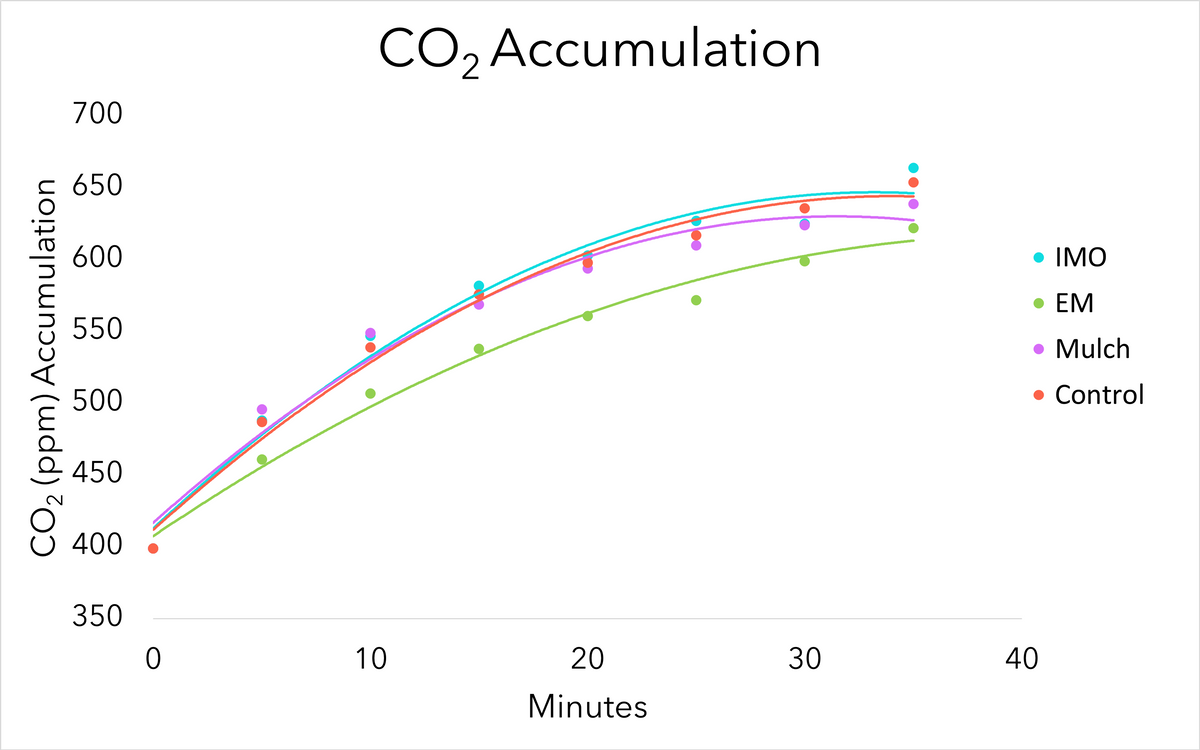
Figure 6. CO2 averaged across all sample times, regardless of season, for the duration of the CO2 testing. Source: Stacy Swartz
Cotton T-shirt strips
The decomposition of cotton strips was observed for all main treatments (Figures 7-8). Less cotton was decomposed in the soil of the control treatment than soil of the EM soil drench treatment (P=0.0542; Figure 8). Without mulch, the control treatment was more exposed to sunlight, which can limit microbial activity by drying out the soil. Without mulch, the control treatment also had less organic material for resident soil microbial life to feed on, which may have limited the growth of the soil microbes.
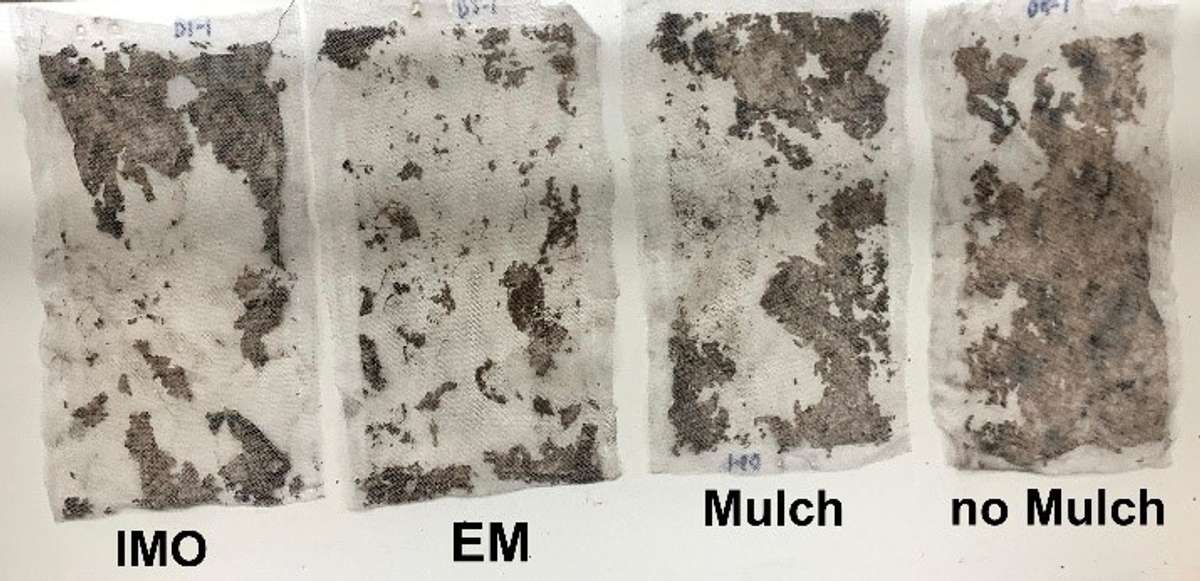
Figure 7. Rep D of the cotton strip assay after cleaning. Source: Stacy Swartz
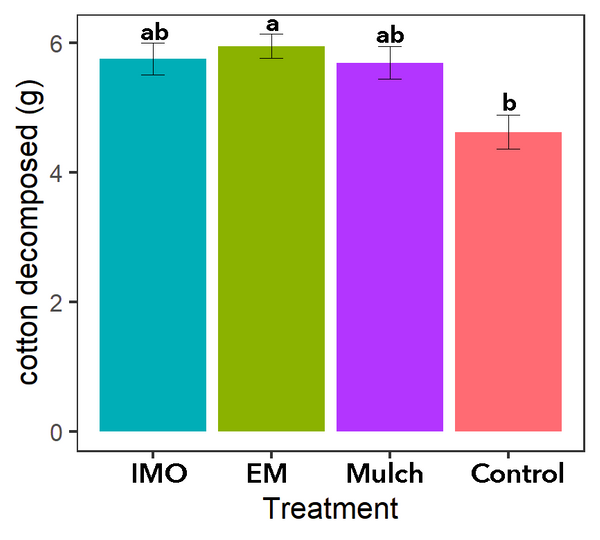
Figure 8. Cotton decomposed during 1 month of microbial activity. Source: Stacy Swartz
Crop Response
Yield
Main treatment of soil drench
Main treatment yield differences were only observed during the cabbage production season with the no mulch control treatment yielding less than the mulch control treatment (Figure 9). While no difference was observed in maize grain, maize number of ears (Table 2) or grams of kale (not included).
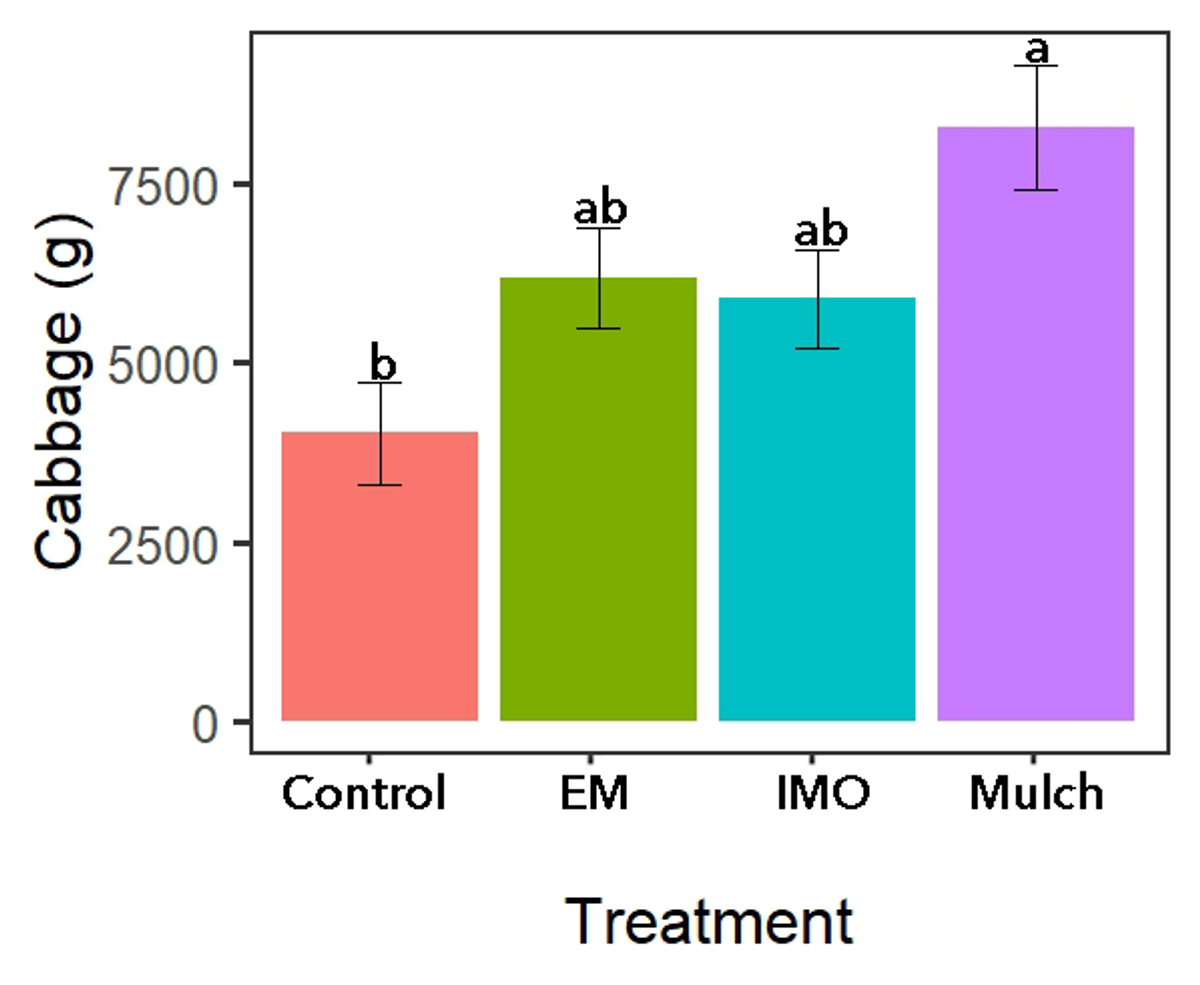
Figure 9. Soil drench treatment yields for cabbage. Source: Stacy Swartz
| Treatment | Average Maize Height (cm) | Maize Grain Yield (g) | Maize ears (avg no.) | Kale (g) |
|---|---|---|---|---|
|
Mulch Control |
101.22 a |
156.63 |
7.1 |
2404.6 |
|
IMO + Mulch |
99.72 a |
163.96 |
7.5 |
2128.4 |
|
EM + Mulch |
98.04 ab |
158.53 |
7.0 |
1777.0 |
|
No Mulch Control |
89.86 b |
197.28 |
7.7 |
1866.0 |
|
P-value |
<0.001 |
NS |
NS |
NS |
Split treatment of fertilization vs. not fertilization
For all three crops, fertilized split treatments produced more grams of edible product than unfertilized split treatments (Figure 10; P<0.05). This was expected, as synthetic NPK fertilizers are easily taken up by plants and used for vegetative and reproductive growth. Differences in maize height were observed at the main treatment level (Table 2), with maize plants generally taller with than without mulch. Differences in maize growth did not result in significant yield responses to main treatments. Moreover, main treatments had no effect on kale leaf production.
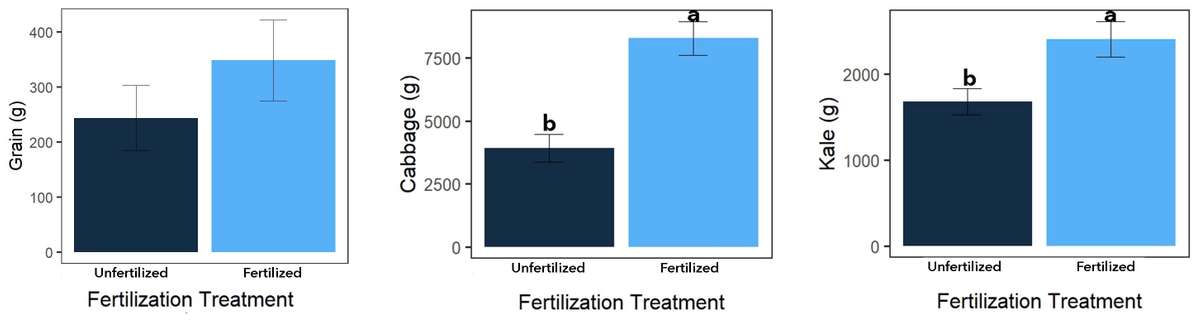
Figure 10. Split treatment yields by crop; P<0.05. Source: Stacy Swartz
Conclusion
This study was conducted in a sandy soil with low organic matter. IMO or EM products may need to be “stepped up” to more stable carbon sources such as bran, compost, or manure before being utilized in soils low in organic matter (Tancho, 2008). This process includes inoculating the more complex carbohydrates in a progressive way (inoculate bran with IMO, then mix with compost until established then mix with manure until established). The more complex carbon sources create a more stable feed source that helps stabilize microbial populations in low-organic matter environments. These practices of “stepping up” do take more labor and resources which makes them less likely to be practice by smallholder farmers. Rushing (2015) reported benefits in plant available nutrients in the soil and soil water holding capacity when IMO4 (manure-inoculated with IMO) was applied to the soil.
Results with EM and IMO may differ in soils with higher levels of organic matter. Although no clear benefits of EM or IMO soil drenches were observed in this trial, other observations useful to smallholder farmers can be drawn from this study. Light fertilization with synthetic NPK fertilizer and use of mulch had yield impacts on cabbage production. Mulch also led to greater amounts of cotton decomposition in the soil, suggesting greater microbial activity in soil under mulch. This trial does not dismiss the benefits of Natural Farming practices but does highlight simple benefits of mulching and synthetic fertilization.
References
Berkelaar, D. 2011. Multiplication and Use of Soil Microorganisms. ECHO Development Notes no. 110.
Bly, A. 2020. Cotton Strip Soil Test: Rapid Assessment of Soil Microbial Activity and Diversity in the Field. South Dakota State University Extension.
Jensen, H., L. Guilaran, R. Jaranilla, and G. Garingalao. 2006. Nature Farming Manual: A handbook of preparations, techniques and organic amendments inspired by Nature Farming and adapted to locally available materials and needs in the Western Visayas region of the
Philippines. PABINHI-Pilipinas and REAP-Canada.
Mayer, J., S. Scheid, F. Widmer, A. Fliessbach, and H.R. Oberholzer. 2010. How effective are ‘Effective microorganisms® (EM)’? Results from a field study in temperate climate. Applied Soil Ecology 46: 230-239.
Mikkelson, Keith O. 2005. A Natural Farming System for Sustainable Agriculture in the Tropics. Aloha House, Inc. Philippines.
Rushing, J. 2015. Indigenous microorganism 4 (IMO 4) as a soil inoculant. A Thesis: University of Hawai’I at Hilo.
Tancho, Arnat. 2008. Applied Natural Farming. Mae Jo Natural Farming Information Center and National Science and Technology Development Agency, Pathom Thani, Thailand.