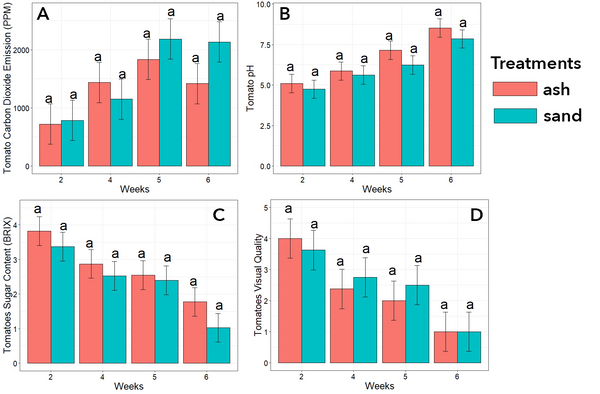
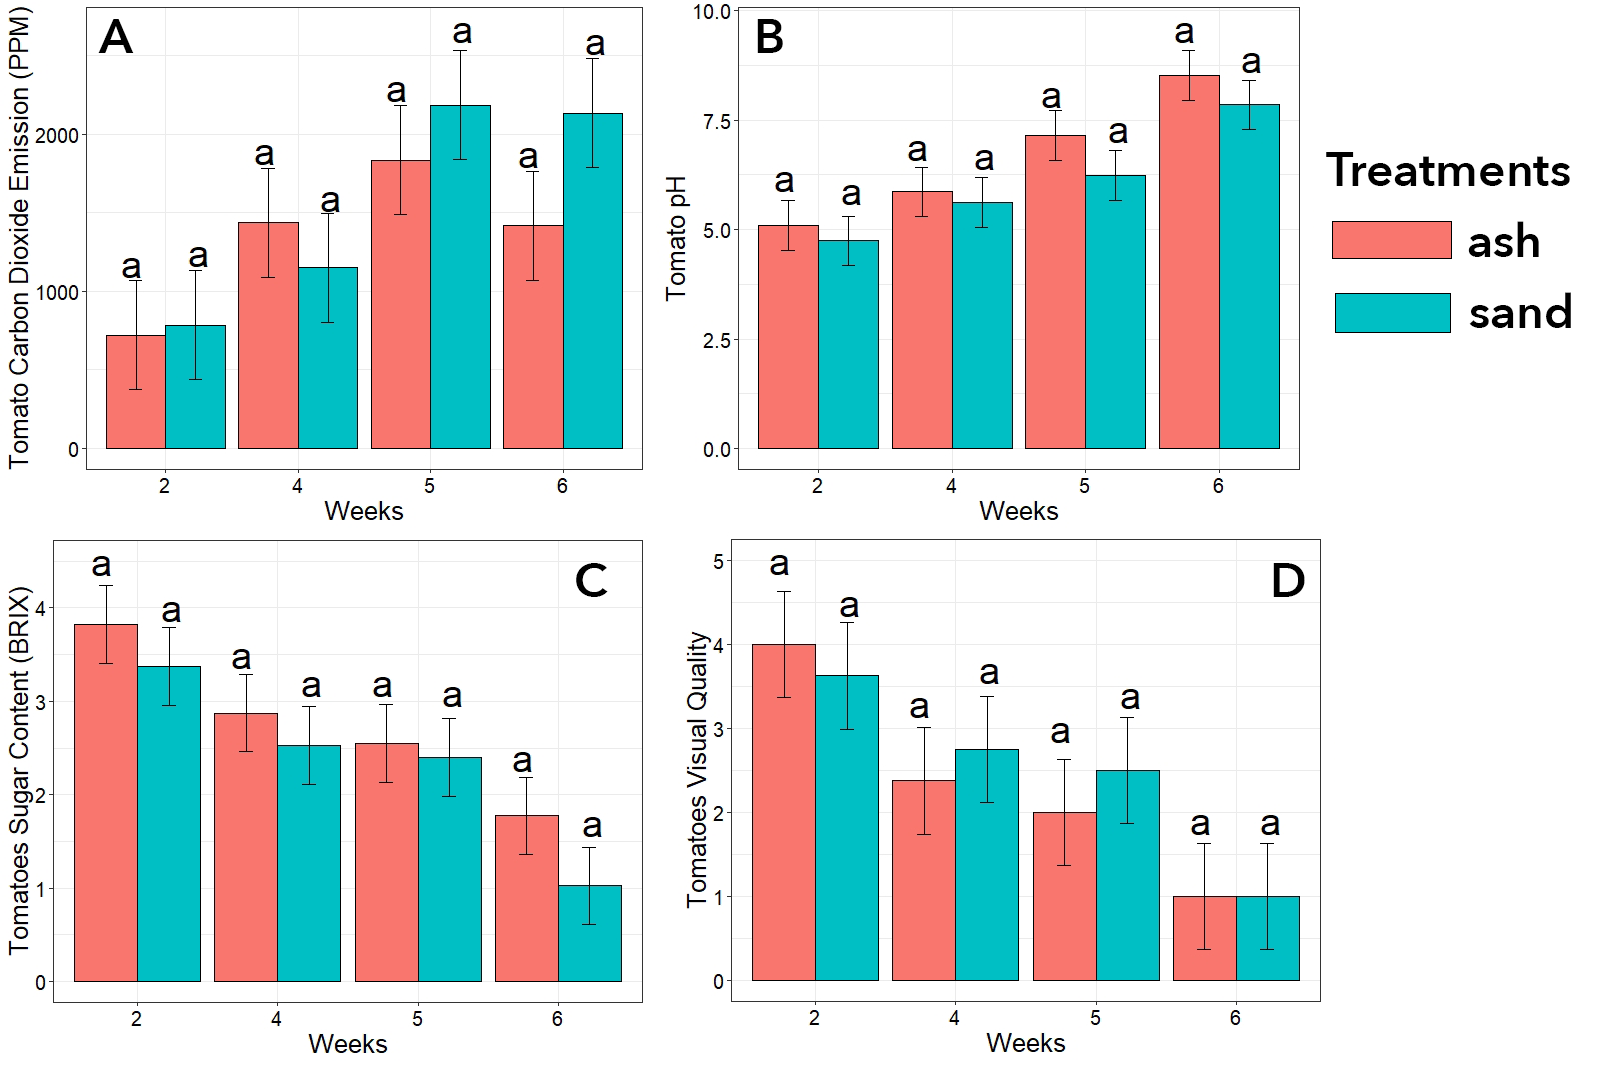
RN2_6 Figure 5
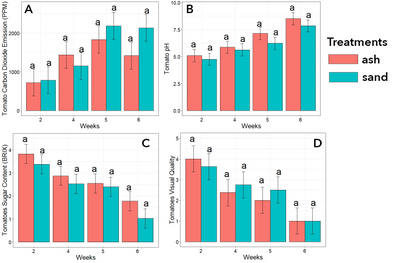
Figure 5.Bar plots showing fluctuation over time, in ash versus sand, of: a) carbon dioxide emitted by the tomatoes b) pH of juice in the tomato flesh c) tomato sugar content d) visual quality of the tomatoes. Letters on top of the error bars express the statistical significance among the treatments over time. Source: Rocheteau Dareus