RN 11 trial design
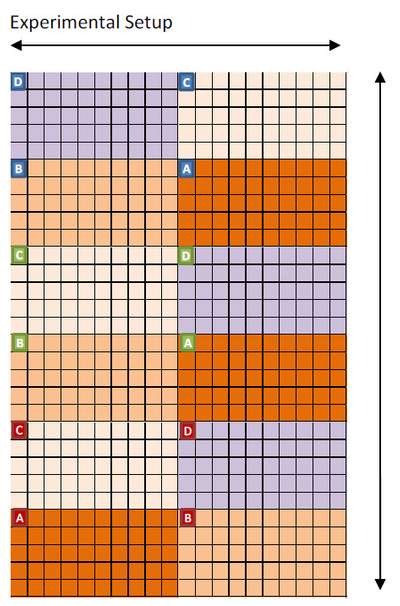
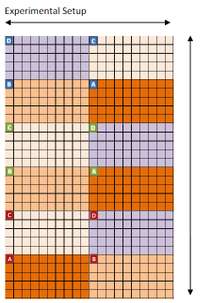
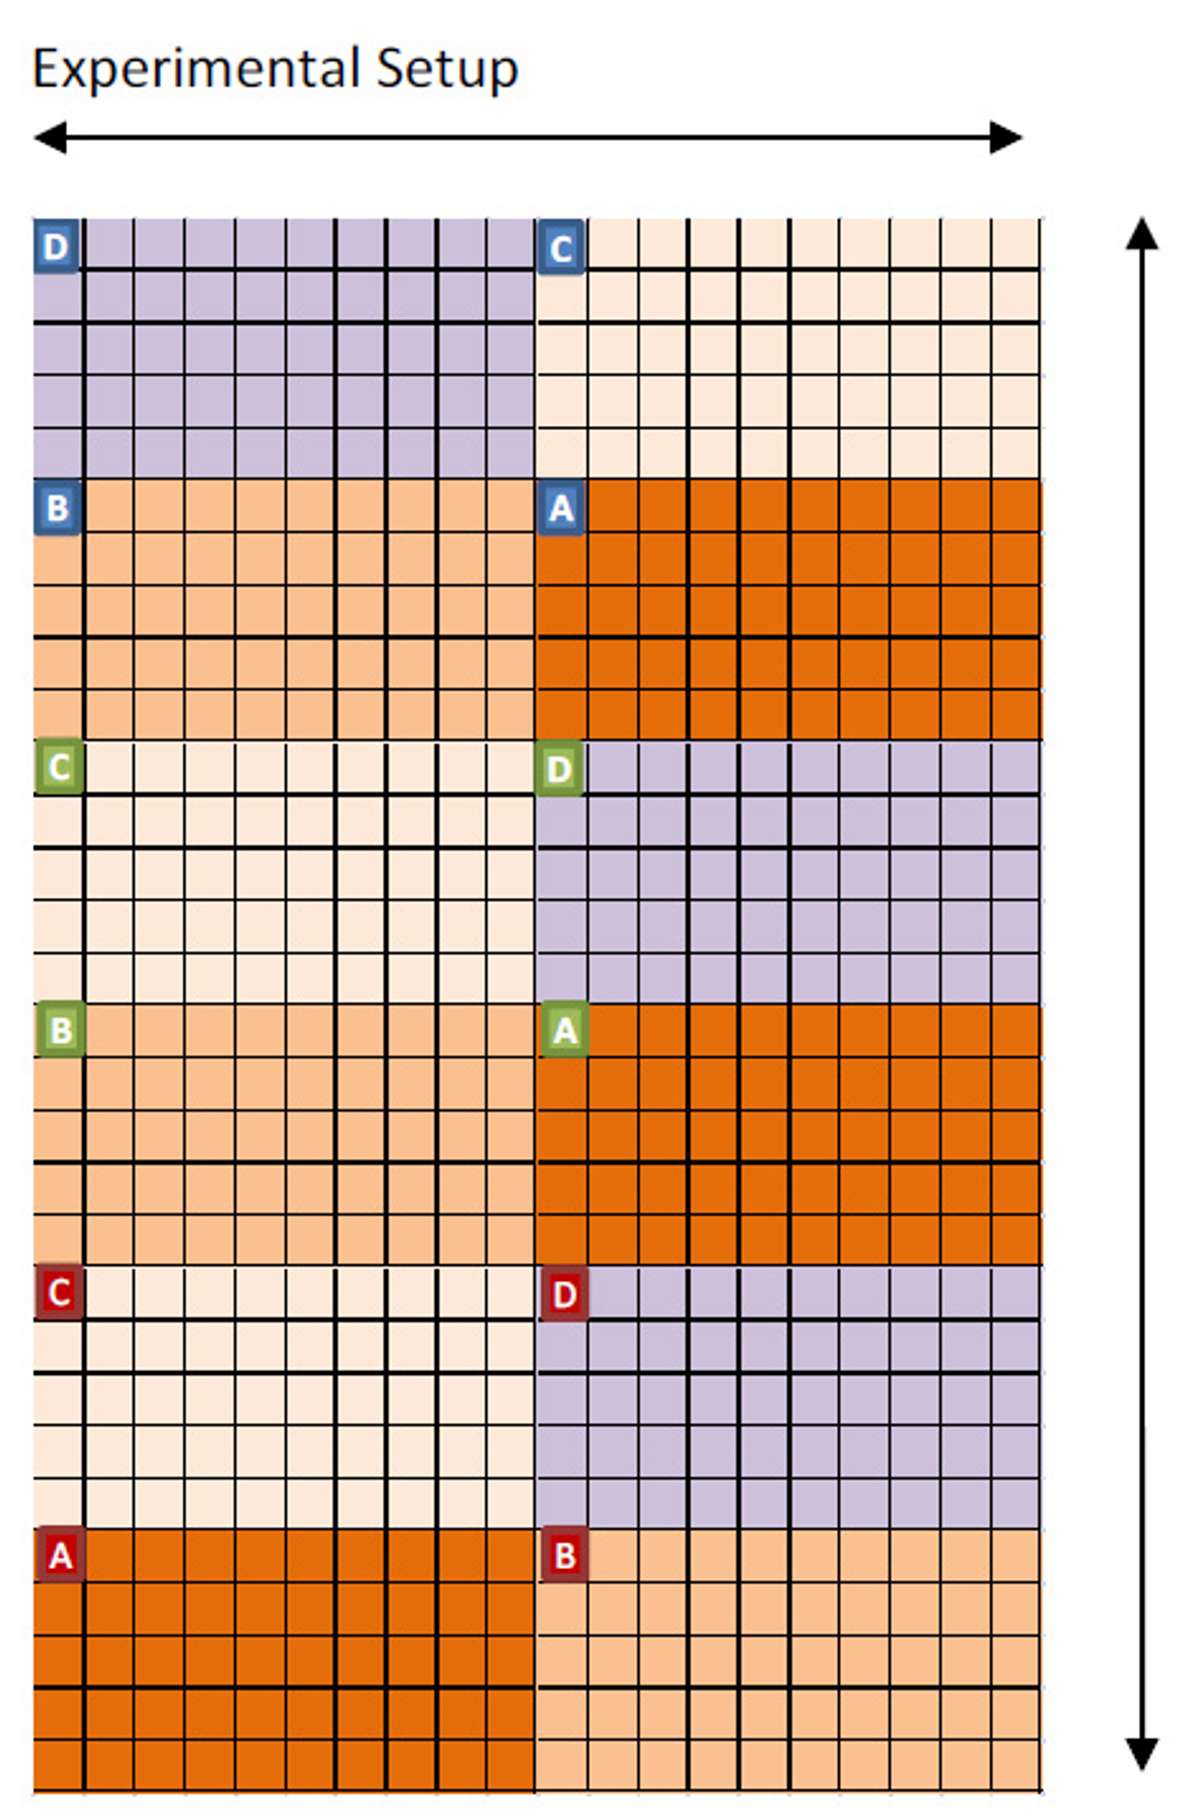
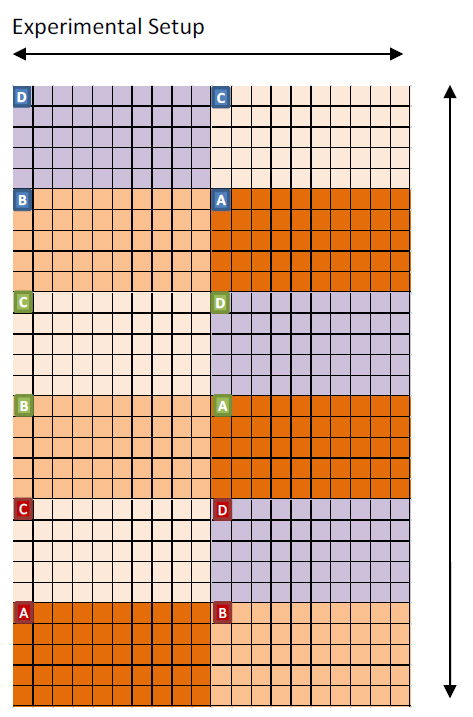
Figure 1. The experiment was set up with a total of three replications, each replication consisting of four plots. These plots are categorized by the type of compost inputted into the 100 planting stations found within each plot. The diagram to the left shows an aria view of the experimental setup. The red, green, and blue square outlines represent the placement of the three replications and colored areas within each square represent the type of composted used. The placement of each plot was the result of a random selection.