VITA 1600 Wilson Boulevard, Suite 500 Arlington, Virginia 22209 USA Tel: 703/276-1800 . Fax: 703/243-1865 Internet: pr-info@vita.org
ISBN 0-86619-039-2
Forward
Local technicians in developing countries increasingly are being called upon to test innovative measures developed by agricultural researchers at the national or regional level. Improved plant varieties, new fertilization practices, irrigation, pesticides, new feed mixtures, and improved harvest procedures are just a few of the more important innovations that must be thoroughly tested at the local level before they are passed on through extension methods to the farmer.
Local research often is not carried out by trained research personnel, but by extension agents, teachers, training center workers, community development agents, foreign technicians, fertilizer and seed distributors, and farmers with large holdings.
The purpose of this book is to show local farmers and others the basic steps to design, execute, and measure an agricultural experiment. This book does not cover statistical anlysis; it is assumed that trained statisticians are available for this purpose.
TABLE OF CONTENTS
Foreward
List of Figures
SECTION I. SOME BASIC CONCEPTS
I. The Need for Local Research
II. An Experiment Versus A Demonstration
III. Some Basic Concepts in Statistics
A. The normal distribution
B. The null hypothesis
C. The "significant difference"
SECTION II. HOW TO PERFORM AN AGRICULTURAL EXPERIMENT
I. Preliminary Research
II. Designing the Experiment
A. Replication
B. Random distribution
C. Selection of treatments
D. Selecting the location
E. Plot size and shape
III. Execution of the Experiment
A. How to lay out a right angle
B. Labeling and mapping
C. Uniform application
IV. Measuring and Recording the Results
A. When should measurements be taken?
B. What should be measured?
C. Put all observations in numerical terms
D. A report procedure
Appendix: Table of Random Numbers
Bibliography
LIST OF FIGURES
-
Normal curve
-
Normal curves with and without fertilizer
-
The completely random design
-
Random complete block
-
Random complete block suitable for demonstration
-
How to make random the Latin square design
-
Split-plot design
-
Plot shape
9-A. Laying out a right angle
9-B. Laying out a right angle
9-C. Laying out a right angle
SECTION I
SOME BASIC CONCEPTS
I. THE NEED FOR LOCAL RESEARCH
Many countries today are experiencing what is called "agricultural development." Basically, this means three things for agriculture: (1) it has become more complex technically; (2) it has become less oriented to home consumption and more oriented to the market; (3) it has become dynamic; that is, it is not simply moving to a new, more efficient level of operation, but is in a continuous state of flux.
In many countries, research facilities have been established at the national and regional level. New plant varieties and innovative cultural practices are being tested successfully at these facilities. But before they can have any effect on farm production, they must be tested thoroughly at research stations, schools, and farms on the local level.
The basic problem facing local experimenters is whether the use of a new or different practice will affect the outcome of some particular segment of agricultural enterprise in their area. If so, to what extent? If farmers fail to adopt a beneficial practice because it has not been tested locally, or if they adopt a harmful practice because it has been tested improperly, local extension agents and those who have carried out experiments must share the blame.
Local personnel have a great responsibility to become skilled in testing and evaluating new practices so that they may avoid such mistakes. If great care is exercised, untrained personnel can become sufficiently expert in experimentation to bring many benefits to the local farmers and, hence, to the entire community.
II. AN EXPERIMENT VERSUS A DEMONSTRATION
What is an experiment?
An experiment is a test or tentative procedure for the purpose of discovering something unknown, or for testing a principle or supposition. It must be carried out in an unbiased manner. No assumptions are made regarding the outcome; the results must always be accepted. If we suspect that the results are not typical, we still must accept them, although we should perform the experiment again. In an experiment, treatments are replicated, or repeated, and they are arranged in test plots or as random units in a procedure.
An observation trial is not used to draw any experimental conclusions, but may determine if a practice is worth testing.
A result trial on a farm is the testing or demonstration of a single practice that has been proven elsewhere, but which is still unproven in the farmer's mind.
What is a demonstration?
A demonstration shows a response that already has been proven in an experiment. It is not conducted according to the specifications for an experiment, and therefore cannot be used to draw conclusions. If it does not demonstrate the expected results, it is ignored, and may then be plowed over to be run again.
III. SOME BASIC CONCEPTS IN STATISTICS
The statistical analysis of results is beyond the scope of this paper, but we must understand some basic concepts if we want to be able to interpret a statistician's analysis of our experiment. The three concepts described briefly here are the normal distribution, the null hypothesis, and the significant difference.
A. The Normal Distribution
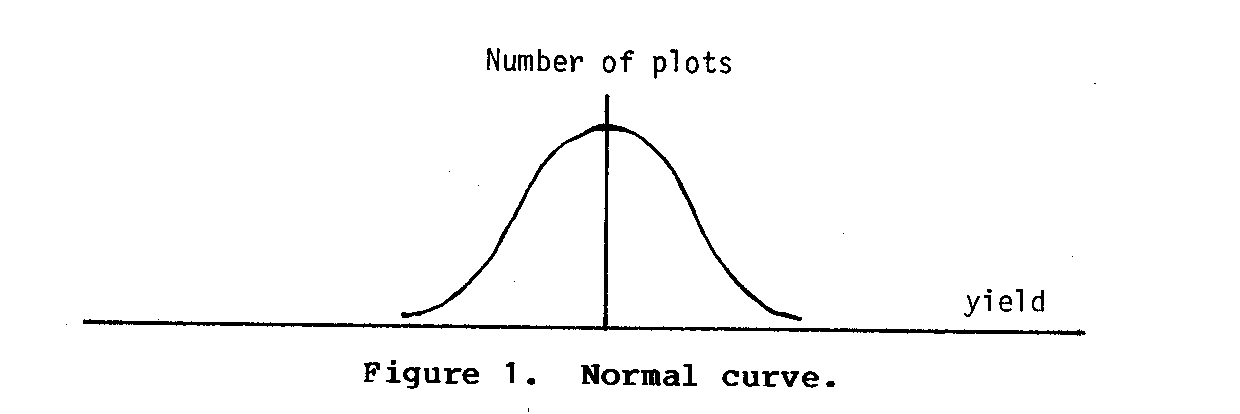
Assume that there is a large amount of some crop that is grown under uniform conditions and harvested in plots of 100 square feet. The yields recorded for each of these plots probably will vary from a very low figure to a very high figure. Most of the plots will yield close to a middle figure. As we move away from this median to either a higher or lower yield figure, we will find successively fewer plots. If the yield is plotted against the number of plots giving a particular yield, the familiar bell-shaped normal curve will result. (see figure 1)
If the same crop is grown under identical conditions with the addition of a fertilizer treatment, there will still be a wide range of yields for the 100-square-feet plots. However, the entire curve will have shifted somewhat to the right. (see figure 2)
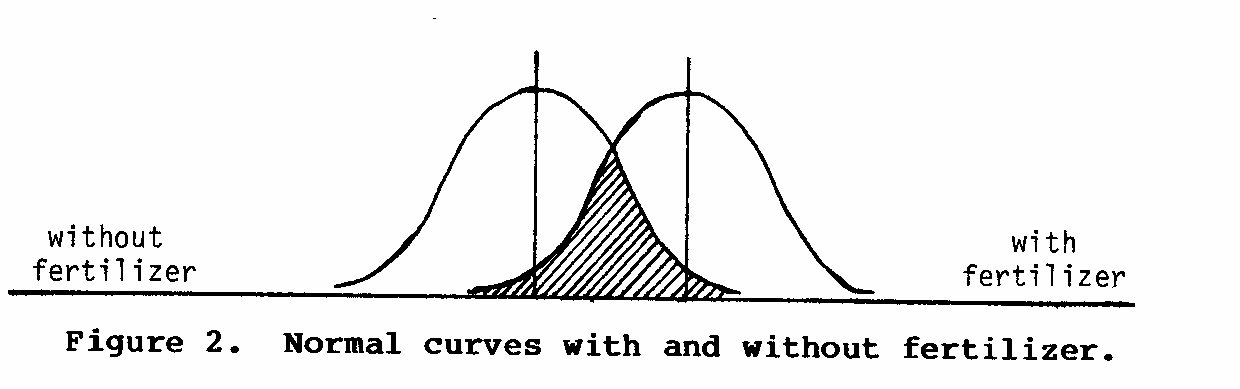
Note that the two curves overlap in the crosshatched area; some plots may yield the same with and without fertilizer. If only a small number of the fertilized plots were measured, it is possible that all or most of them would fall in this shaded area. We would not know from our measurements whether the fertilizer had really increased the yield.
The purpose of proper experimental design is to allow us to determine whether the treatments have actually shifted the normal curve, or whether the effect we observe is simply due to chance. This brings us to the next concept.
B. The Null Hypothesis
The statistician begins the analysis by assuming that the treatments had no effect, and that any effect observed was due simply to chance. This assumption is known as the null hypothesis. If we flip a coin and get "heads" four times in a row, we assume this to be due to chance and not because of some special quality of the coin.
Next, the statistician processes the data to determine the validity of the null hypothesis. He or she may reject the null hypothesis, deciding that the observed effect of the treatment was significant, and probably not due to chance. Or, he or she may accept the null hypothesis, concluding that the observed effect of the treatment was probably due to chance.
C. The "Significant Difference"
The term significant will be found in the results of many experiments. This may also be indicated by an asterisk (*) or by the phrase "significant at the 5% level." These all indicate that the statistician has determined that there is only a five percent chance that the observed difference was due to chance. If the results are found "highly significant," indicated by a double asterisk (**) or by the phrase "significant at the 1% level," this indicates that there is only a one percent probability that the observed effect of the treatment was due to chance.
This discussion indicates that a single experiment, no matter how carefully designed and executed, cannot conclusively "prove" that a treatment has a significant effect. This is why experiments should be repeated.
SECTION II
HOW TO PERFORM AN AGRICULTURAL EXPERIMENT
I. PRELIMINARY RESEARCH
Good preliminary research, including a search of the available literature and interviews of experienced persons, will save a great deal of trouble later. The experimenter should not be afraid to ask for help now; help may be of no use once the experiment has been laid out. The preliminary research should cover the following points:
(1) A careful study of the crop should be made. The local soil should be studied in fertilizer and irrigation experiments. For pest control experiments, information on the life cycle of the pest should be obtained.
(2) Economic factors should be studied, especially if a new crop is being introduced. Will treatments affect the market for this crop? What is the cost of treatments?
(3) Has this experiment been performed already? Quite likely, a similar experiment has been carried out. Were the results clear, and do they affect the planned experiment? Have similar experiments been carried out in other districts?
The preliminary research should be recorded so that it may be included in the final report.
II. DESIGNING THE EXPERIMENT
In any experiment, errors are introduced by factors beyond the control of the experimenter: soil heterogeneity, plant variability (due to genetic variability), plant competition within and between plots, variation in the moisture content of harvested plants, climate variations (when experiments are run for more than one year) , and the size and shape of plots. Such errors cannot be eliminated, but they can be reduced, primarily by the replication of treatments and use of random distribution, careful selection of treatments and location, and the proper design of plots,
A. Replication
Replication is the repetition of a treatment several times to obtain a mean value or yield. In field experiments, a single replicate generally is planned to contain one plot of each treatment in a rather compact block. Replication is accomplished by repeating blocks. A nonreplicated trial is not an experiment.
The number of replications depends upon the degree of precision desired and the degree of soil heterogeneity. Generally, two replications is not enough. The American Society of Agronomy suggests 3-6 replications for field plots. The small number suffices where average rather than annual results are desired. For corn yields, 4-6 replications are often used. For small nursery plots, 5-10 replications are recommended.
B. Random Distribution
Random distribution means that treatments are assigned to plots in a random fashion, or are placed randomly within a block. The reason for doing this is to eliminate any bias that might occur if we assigned treatments to plots with some kind of order or system.
The random distribution procedure should be completely objective. It may be accomplished by flipping a coin, drawing cards from a deck, or by using a specially prepared table of random numbers, such as the one found in the appendix of this paper.
1. The completely random design
This design results when treatments are assigned to a previously determined number of plots. It is useful for some types of treatments on animals, but is not an efficient design for field trials with plants. Its main advantage is its simplicity and flexibility. Treatments are assigned to plots by drawing cards from a deck, slips of paper from a container, or by using the table of random numbers in the appendix.
Example: A, B, and C represent three different levels of nitrogen tested on wheat. Four samples for each level X three levels = 12 plots.
2. The random complete block
In this design, treatments are assigned at random within a block, and the entire block is replicated (see Figure 4). The

blocks should be kept as compact as possible, and the number of treatments as low as possible consistent with the objectives of the trial.
The main advantage of the random complete block design is the high reliability of the data obtained from it, and its suitability for demonstration (as seen in Figure 5).
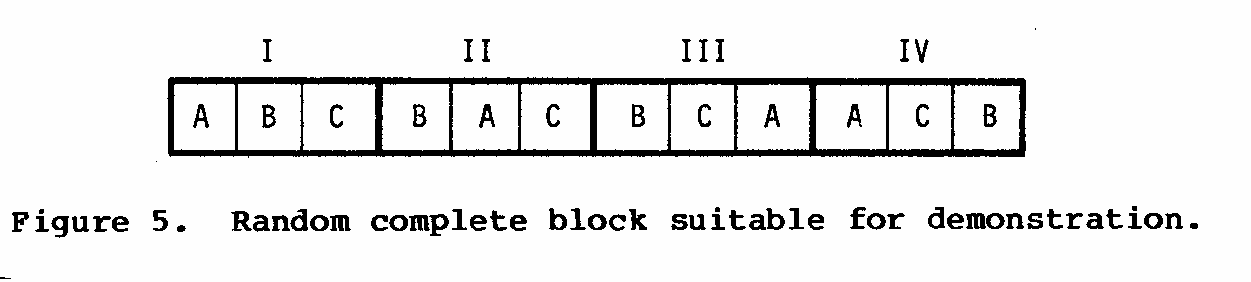
Example: A-F are six different fertilizer treatments for sugar beets. Note that each treatment occurs once in each block. Six treatments X five replications = 30 plots.
3. The Latin square design
In this design, treatments occur once in each column and once in each row, and treatments are random in both directions (see Figure 6). Thus, the Latin square removes variability in two
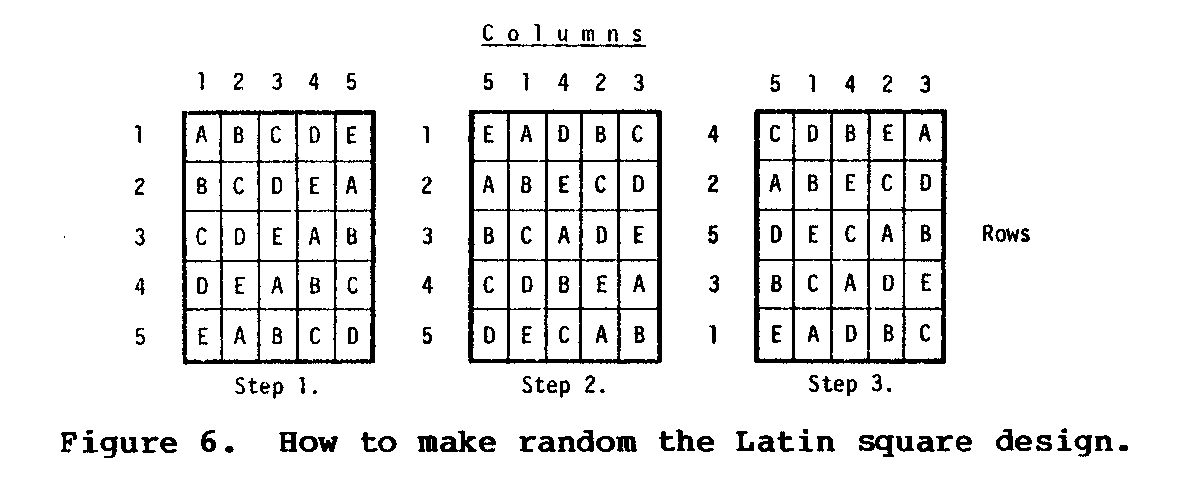
directions while the random complete block removes it in only one direction. The number of replications always equals the number of treatments in a Latin square design. It is more precise than the random complete block, but it becomes cumbersome for more than eight treatments.
In Figure 6, columns and rows are first numbered from 1 to 5, and treatments are assigned to the plots in regular alphabetical order, simply rotating the order one place in each row or column.
In the middle square, we have the same square after the columns have been rearranged by choosing at random the numbers at the heads of the columns.
In Step 3, we have now chosen the rows at random by the same method. The procedure is completed. Note that in the righthand square, treatments appear only once in each row and column.
4. The split-plot design
This design is used to test two factors in combination. It is not the most precise design for this purpose, but is often used to facilitate physical operations. For example, some field treatments, such as irrigation, are more conveniently applied to relatively large strips through the experimental area. If different dates of harvest are one of the factors being tested, it may be easier to harvest in strips through the experimental area rather than to harvest a few feet of one row and then skip across rows for another small harvest area.
There are many split-plot designs. They vary in precision. If possible, an experienced person should be contacted for advice before one uses this design. The basic design involves assigning one factor to main plots that are arranged in random complete blocks or in a Latin square. Assign to the main plots those treatments for which you are willing to sacrifice precision. The treatments of the second factor are assigned at random to sub-plots within each main plot.
Example: Planting dates and fertilizer treatments on tomatoes. Three planting dates (main plots) X four fertilizer treatments (subplots) X three replications = 36 plots.
C. Selection of Treatments
Many factors that influence the farmer's profit can be applied as contrasting practices in an experiment. Rate of seeding, date of planting, spraying and dusting treatments, fall vs. spring plowing, method of seed bed preparation, surface vs. furrow application of irrigation water, weed control by herbicides vs. cultivation, fertilizer treatments, pasture grass-legume mixtures, and crop rotations are only a few of the more important ones.
In selecting fertilizer treatment rates, it is desirable to use rates that differ by equal intervals, such as 20, 40, 60, 80, and 100 pounds of nitrogen per acre. We may have an idea of what rate would be inadequate and what rate would be well in excess of optimum. We should test the entire range, including two or three levels between the minimum and maximum. An untreated control plot is not necessary in a fertilizer plot where it is understood that the crop needs some minimum level of fertilizer to grow well. However, the demonstration value of any experiment will be enhanced if we designate a control plot that represents the local practice.
In a factorial experiment, the effect of more than one factor is studied. For example, we may study the effects of four levels of nitrogen and three levels of phosphorus. This would give 3X4 or treatment combinations. You should try to keep the experiment simple, not studying too many factors at once.
D. Selecting the Location
This is a highly critical step in the performance of an experiment. The most important consideration in selecting a location is soil heterogeneity. It was formerly believed that "the experimental field should contain many different soil types to be representative." This is a misconception. The soil should be representative of that generally found in the area. However, the land within the experimental area should be as uniform as possible with respect to topography, fertility, the subsoil, and previous management.
The causes of soil heterogeneity are the following:
(1) Topography: hillsides may cause gullies and the washing down of nutrients. Low spots or variation in the texture of the subsoil will cause plant variation.
(2) Variation in the moisture content.
(3) Variation in the penetration of irrigation water.
(4) Wide variation in available soil nutrients.
(5) Competition and shading from trees and hedgerows.
(6) Past use of the soil, including previous varietal and cultural trials, and previous applications of organic matter, fertilizer, and crop refuse.
What steps can we take to reduce the soil heterogeneity?
(1) Select land with a slight (1-2%), uniform slope. Avoid the use of draws, lowlands, and other irregularly shaped pieces of land.
(2) Where previous trials have been run that might affect soil uniformity, grow one or more "blank trials" before experimenting. A blank trial is a single crop--preferably a small grain--that is grown as uniformly as possible over the entire field to "smooth out" soil variations.
(3) Place new plots at a right angle to previous plots.
(4) Select land at least 20-30 yards from trees, hedgerows, and roads.
(5) Record all information concerning the past history and present condition of the land and included it in the final report. This will assist others in interpreting the results.
E. Plot Size and Shape
5. Plot size
In most local experiment stations or schools where land is limited, the size and shape of the plot is a matter of convenience. However, there are several considerations to take into account.
There are two basic plot sizes: (a) nursery plots, cared for by hand, which often have multiple short rows 10-22 feet long; and (b) field plots, adapted to the use of standard farm machinery. Larger plots commonly are used for corn, sugar beets, and hay rather than for small grains. Small plots may be necessary where many varieties or strains are being tested, where the amount of seed of a new variety is limited, or where funds are short.
Researchers generally agree that an increase in plot size will reduce the error for plots up to about 1/40 acre (100 square meters). Above that size, the decrease in error is less than would be provided by an increase in the number of replications. Small plots are more variable due to (a) fewer plants, b) losses in harvest or errors in measurement, and (c) competition and greater border effects.
6. Plot shape
Plot shape generally makes no difference. Relatively long, narrow plots should have their long dimension facing in the direction of the greatest soil variation so as to overcome soil heterogeneity.
There are two other practical considerations in plot shape. First, plots should be sufficiently wide to allow border strips to be removed or to minimize the importance of borders that remain. Second, field plots should be of a shape and size to accommodate farm machinery.
7. Suggested plot sizes and shapes for various crops (from Field Plot Technique by E. L. Leclerg, et al.
* Small grain: 3-4 rows X 10-20 feet (center rows harvested).
* Corn: 4-6 rows X 10-12 hills.
* Soybeans: 1-4 rows (2-3 feet apart) X 16 feet.
* Sorghum: 2-4 rows X 30 feet (center rows harvested in 3 and 4 row plots).
* Alfalfa: 7 feet X 60 feet (center five feet harvested with a mower); 5-8 drilled rows 7" apart with a 12-14" alley between border rows; 3-5 drilled rows 12" apart with an 18" alley, and the entire plot harvested.
* Sugar beets: four rows (20-24" apart) X 30-60 feet (plants thinned to 12" apart in row)
8. Border rows and guard areas
When there is competition between adjacent rows of different varieties, especially where they differ in growth habits, serious error may be introduced. In semi-arid or sub-humid areas where plants compete for water, small grain yields are greatly affected by plant competition. For this reason, single row plots are not used. With many crops, 3-5 row plots are grown, but the two outside rows are not harvested for yield. Where alfalfa rows are spaced 7" apart, interplot competition is a serious factor. If alleys between plots are widened to 14", border rows should still be removed because the alley itself may allow border rows to grow more vigorously than the plants on the inside rows.
Fertilizer application often requires the use of machinery, but the flow of such fertilizer may not be precisely controlled on the ends of the field. Therefore "guard areas" 1-2 feet wide at the ends of the plot are thrown out.
III. EXECUTION OF THE EXPERIMENT
A. How to Lay out a Right Angle
If the corners of the plots are not laid out at exactly 90 degrees, plots will cover a different area than we imagine they do. The following procedure is based on the fact that a triangle with sides in a 3:4:5 ratio forms a perfect right angle.
Equipment
* 50-foot cloth tape measure, heavy string, or wire marked at 30, 40, and 50 feet.
* Stakes
* String
Procedure
(1) Lay out a baseline with stakes and string. The length of this line will equal the desired width of the total plot. Place two stakes (A and A') as corner posts, as shown in Figure 9-A. Connect A and A' with string.
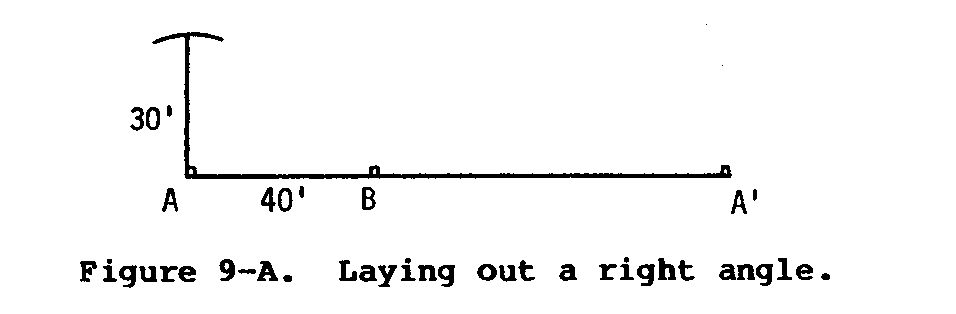
(2) Place a third stake (B) next to the string exactly 40 feet from A.
(3) Have a co-worker hold the end of the tape on corner stake A while you draw an arc with a 30-foot radius. You should swing the extended tape to draw this arc across the approximate place the side boundary will pass.
(4) Have the coworker hold the end of the tape at stake B. Following the same procedure as in step (3), draw an arc with a radius of 50 feet, as shown in Figure 9-B. Place a
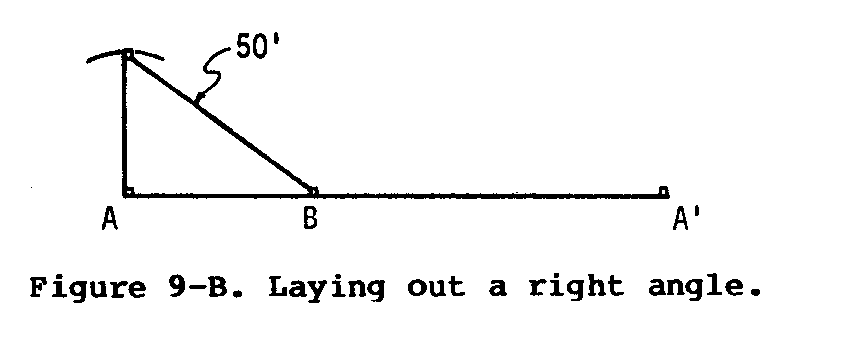
stake (C) where the two arcs cross.
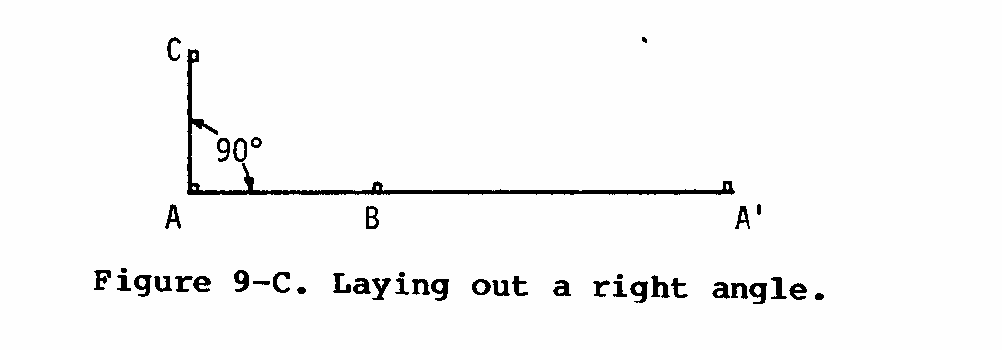
(5) Tie a string from stake A to stake C. This forms a right angle at A (see Figure 9-C). Now repeat the process at A'.
B. Labeling and Mapping
Accurate mapping and labeling is a simple procedure that is crucial for a successful experiment. For example, if someone pulls up your marker stakes before the experiment is completed, and you have made no map for your records, the experiment may be ruined.
You must draw a map because field markers often are obliterated by weather or tractor drivers. The map should refer to permanent structures, such as fence posts, standpipes, building corners, etc. You should be able to locate each separate treatment exactly, even if all the stakes, strings, and labels are removed from the field. Also at this stage, the planned treatments should be listed and described. The map should indicate which treatment each plot receives.
Field markers should be written in grease pencil, which will not wash off in the rain or by irrigation water. Stakes may be used to label plots; cardboard tags often are used in orchards. Make sure your application, the field markers, and the map all agree at the time treatments are applied.
C. Uniform Application
Failure to apply treatments uniformly is a very common mistake that decreases the value of the experiment. Great care should be taken to insure that fertilizer, pesticides, seed treatments, etc., are applied uniformly over the plot, as specified.
Application equipment should be cleaned between trials. Seeds must be swept out when different varieties are being planted.
If more than one worker is applying treatments, do not have the same worker apply the same treatment over more than one replication.
Do not inadvertently add factors. For example, when fertilizer is side-dressed on a row crop, the shoes on the applicator may prune some of the roots, and this will affect plant growth. The proper untreated check would consist of a plot through which the fertilizer rig had been pulled without the material. Seed soaked in a chemical should be compared with seed soaked in water, not with dry seed.
Carefully weigh all the materials used, if so required. Calibrate application equipment to make sure you are putting on the amount you think you are. Fertilizer elements should be mixed several weeks before the application to allow time for any chemical reactions to take place.
Obtain a uniform stand. Small grains will tiller--or put forth new shoots--where adjacent plants are missing, but corn and many row crops will not "fill in" empty areas. One solution is to plant thick, then thin down to the desired stand.
Uniform care of plots is important. Weeds greatly influence crop yields and should be removed early in the trial.
IV. MEASURING AND RECORDING THE RESULTS
Considerable time and expense has been spent thus far, yet many experimenters fail in the end because they measure and record the results improperly. The experimenter may take measurements at the wrong time. Or he or she may take measurements at the right time, but fail to put all results in numerical terms. He or she may measure at the right time, and do so in numerical terms, but fail to measure all the affected attributes. Or the experimenter may do all these things correctly, but not record the results in a simple, complete form.
A. When Should Measurements be Taken?
Different varieties mature at different times, and therefore should not all be harvested at the same time. The experimenter must watch closely and harvest each variety as it matures. He or she must record the total days to maturity for each variety.
The rate at which results are reached is sometimes important. For seed germination, both the rate of emergence and the percentage of seeds germinating should be recorded.
B. What Should be Measured?
This is an extremely important question, one not adequately considered by inexperienced experimenters. In some experiments, workers may simply harvest and weigh the crop with no consideration for other factors that are important on the market, and which may have been affected. The market and nutritional value of the product must always be kept in mind. Even at a local experiment station or school where there is no sophisticated measuring equipment, there are many attributes that can be measured. For example, fertilizer treatments on tomatoes may affect not only the total yield, but also the time to maturity, the color, the size and shape, and the susceptibility to diseases. For corn, the number of ears should be counted, and--if facilities are available--the moisture percentage measured for a sample of ears that represent all sizes, with kernels from one or two rows on each ear.
The following are other attributes of field and horticultural crops that might be measured:
* Sugar content of sugar beets
* Specific gravity of potatoes
* Grade of peaches
* Oil and protein content of soybeans
* Coumarin content of sweetclover
* Hulling percentage and milling quality of oats
* Ginning and fiber properties of cotton
* Pithiness of carrots
In short, when deciding what to measure, always keep in mind the value of the product on the market.
C. Put All Observations in Numerical Terms
Many attributes of quality do not readily lend themselves to measurement in numerical terms. For example, we may want to measure the amount of insect damage on crop leaves after pesticide treatments. It may seem easiest to judge damage as "light," "moderate," and "heavy." But unless we put everything in numerical terms, a statistician cannot make use of our results.
In the case of disease or insect damage, a convenient numerical scale should be set up. For example, to measure potato scab, set a scale ranging from 0 to 10. Zero represents a potato completely free of scab, and 10 represents a potato entirely covered with scab. In some places, standard scales have been established--1-5 or 1-7--and photographs representing each step are used as a method of standardization. In general, the following recommendations may be made.
(1) Try to design the scale so that observations are normally distributed, that is, the middle number is the most frequently observed.
(2) There should be as many steps in the scale as an experienced observer can distinguish.
(3) Where any individual judgment is involved in making observations, try to avoid having more than one person make the observations.
D. A Report Procedure
Research is a continuous process, even at the local level. Single experiments seldom determine new farming practices; the results of several experiments have a cumulative effect. For this reason and others, the written report of our experiment must receive some attention. It must be complete, but not overly complex. It must convey clearly and concisely what the experimenter tested, under what conditions the test took place, and the results. If the report is to be placed in a file with similar reports, there may already be a standard format. if there is no sample format, the following is generally acceptable:
(1) Title page. This should indicate clearly the nature of the experiment. The experimenter's name, the date, and location must be included.
(2) Introduction. This must include a review of the literature and basic background information, including all similar experiments carried out previously. The problem must be defined.
(3) Procedure. This must include pertinent soil and climatic conditions, a careful description of the treatments, and an explanation of how the treatments were applied.
(4) Results. These should be given in both tabular and graphic form, with the results of the statistical analysis shown clearly.
(5) Conclusion and recommendations. As a minimum, any further experiments called for by the results should be mentioned.
(6) Appendix. This may include a plot map and the statistician's calculations.
APPENDIX: TABLE OF RANDOM NUMBERS(1)
To make random any set of ten items or less, begin at a random point on the table and follow either rows, columns, or diagonals in either direction. Write down the numbers in the order they appear, disregarding those that are higher than the numbers being made random and those which have appeared before in the series. If you wish to make random more than ten numbers, pairs of columns or rows can be combined to form two digit numbers and the above process followed.
(1) Thomas M. Little, and F. J. Hills. Experimental Methods for Extension Workers. (Davis, California: University of California Agricultural Extension Service, 1966), p. 55.
BIBLIOGRAPHY
Hopp, Henry. A Guide to Extensive Testing on Farms. Washington, D.C.: USDA Foreign Agricultural Service, 1951.
Leclerg, E. L. , Leonard, W. H. , and Clark, A. G. Field Plot Technique. Minneapolis: Burgess Publishing Co., 1962.
Little, Thomas M., and Hills, F. J. Experimental Methods for Extension Workers. Davis, California: University of California Agricultural Extension Service, 1966.
ABOUT VITA
Volunteers in Technical Assistance (VITA) is a private, nonprofit, international development organization. Started in 1959 by a group of concerned scientists and engineers, VITA maintains an extensive documentation center and worldwide roster of volunteer technical experts. VITA makes available to individuals and groups in developing countries a variety of information and technical resources aimed at fostering self-sufficiency--needs assessment and program development support; by-mail and on-site consulting services; information systems training. It also publishes a quarterly newsletter and a variety of technical manuals and bulletins.
VITA 1600 Wilson Boulevard, Suite 500 Arlington, Virginia 22209 USA Tel: 703/276-1800 * Fax: 703/243-1865 Internet: pr-info[at]vita.org