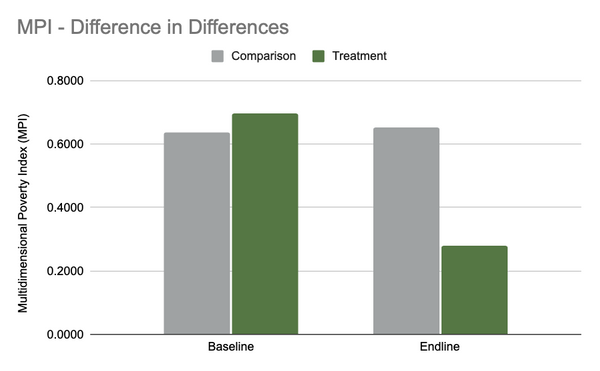
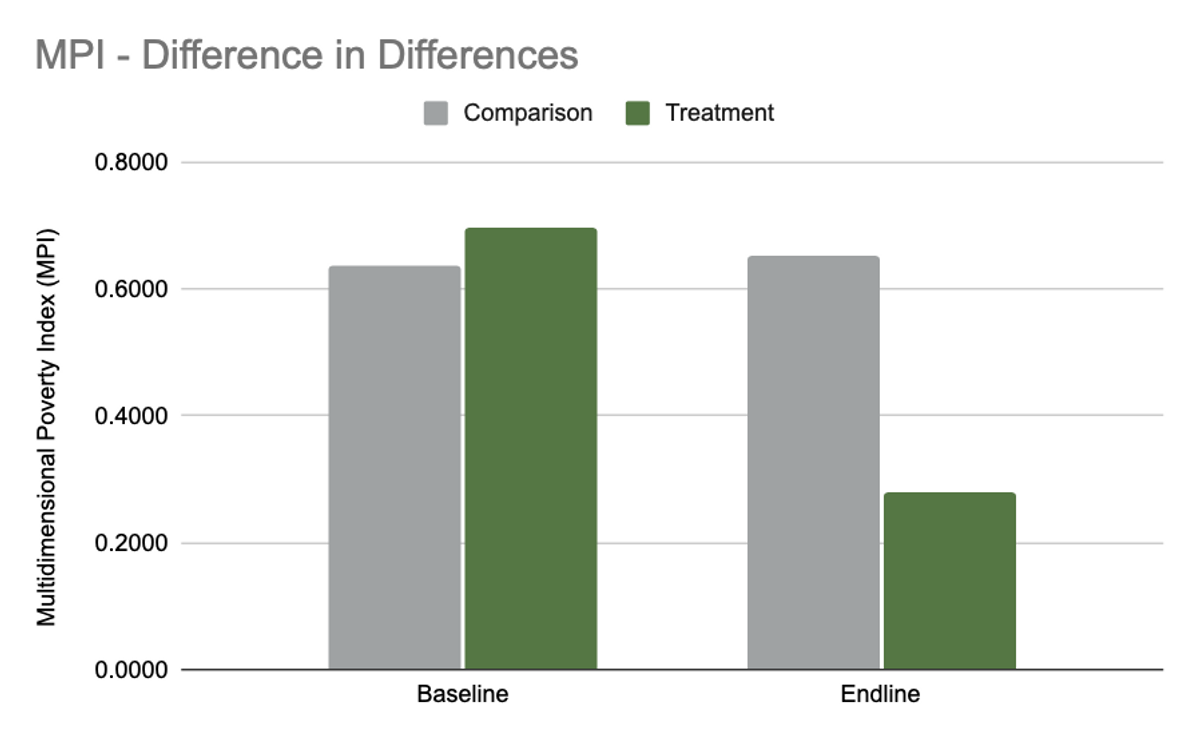
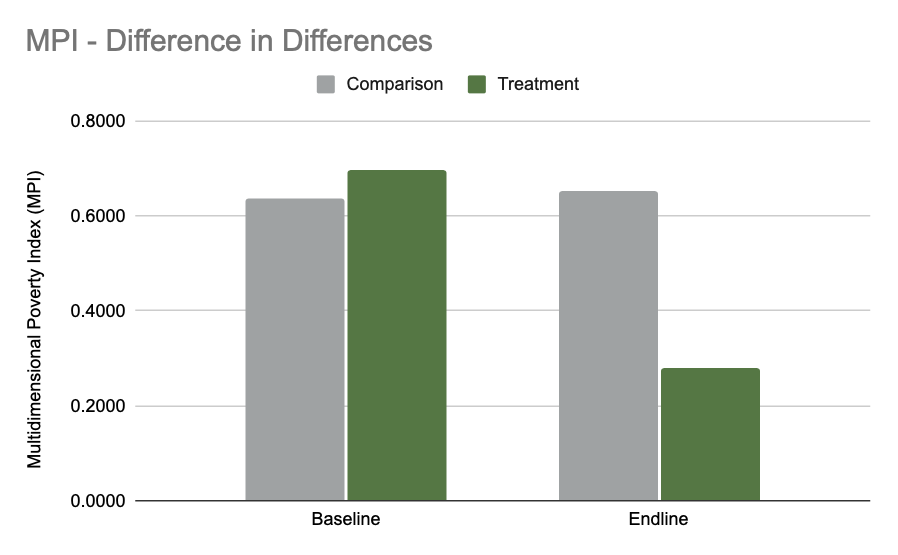
Figure 15. DID results of Plant With Purpose program in the DRC. Bar graphs show the change in Multidimensional Poverty Index (MPI) from baseline to endline, for a Treatment watershed and the Comparison watershed.
You are sharing: EDN171 Figure 15
